Models: Task Taxonomy
Table-of-contents
- Introduction
- Data Layer
- Technology Layer
- Interaction Layer
- Tasks
- Prototypes classified by the Taxonomy
- References
Introduction
Describing applications for Elastic Displays by categorization based on data types has some limitations, as it allows no distinction between content and the metaphors that are used to interact with the content. For example, DEEP - Data Exploration on Elastic Projections, uses physical interaction metaphors based on spatial deformation to interact with a zoomable user interface. In the data-model, the content is pure planar 2D, whereas interaction is based on concepts that we associated with the spatial 3D domain.
Additionally, we found that the technological foundation also plays a certain role for the interaction design - not only as limiting factor, but also by empowering certain specific interaction metaphors (e. g. unconstrained masking capabilities when using pixel blending concepts based on the depth image)
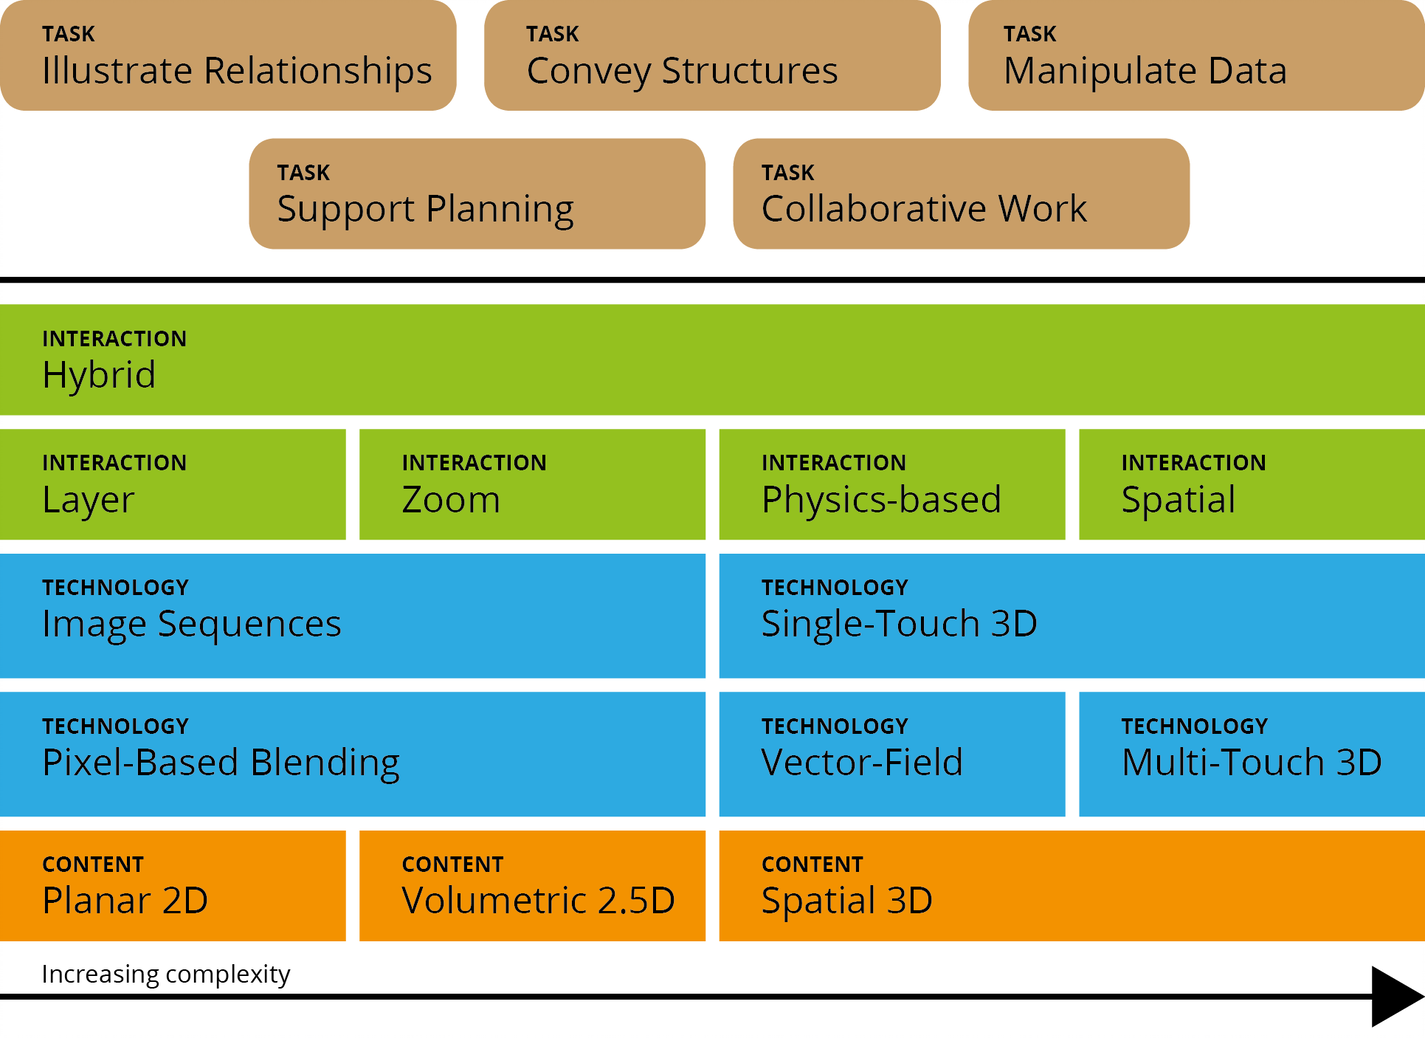
Therefore, the model was extended to a task taxonomy [10], that contains a technology layer, data layer and interaction layer and additionally tries to describe the most common task types that are suitable for Elastic Displays. It is inspired by Shneiderman’s Task by Data Type Taxonomy for Information Visualization [20] and is based on practical experiences with existing prototypes and reviews of literature.
Data Layer
The data layer serves as the foundation of the model. The detailed description can be found in Models: Data Types.
Technology Layer
On this level, we distinguish five different technological concepts for making the content types described above accessible on an Elastic Display. Although there is no strict 1:1 mapping between data and technology, some data types are more commonly used with specific technologies (e.g. Pixel Blending and Volumetric content), which we try to visualize by the position and the extension of the technology fields.
Image Sequences
The most basic concept is using image sequences that are subsequently displayed according to different depth values. Only the depth value of the global maximum is computed, ignoring the lateral position. Using this approach, a large number of images can be used, and a smooth, stable interaction is achieved. The disadvantages consist of a very limited user interface and a low expressiveness of the interaction. Both the Time Domain Viewer from ElaScreen [24] and the FlexiWall Big Data Layers application [9] use this basic technology.
Pixel-Based Blending
This approach is based on blending several images based on the depth image. It is suitable for rapid prototyping using either planar or volumetric data. Disadvantages are the limited number of images and real user interface elements cannot be used. However, the effect is appealing and is used most frequently in the reviewed applications: Khronos Movie Viewer [1], impress 3D-modelling [7], ElaScreen 3D Scene Navigation [24], eTable 3D-viewer [12] as well as FlexiWall Image Effects, Map Viewer, and Painting Explorer [15].
Vector Field
As exhibited by the DepthTouch prototype [18], a force simulation is achieved based on per pixel derivatives. This allows true and natural flexible interaction metaphors. However, this approach suffers from an incomplete depth im age analysis and a user interface that is difficult to adapt to requirements that exceed the physical metaphors. Additionally, manipulation of content is achieved mostly by indirect interaction. The only productive application from our review using this technology is ElaScreen’s Graph Visualization [24].
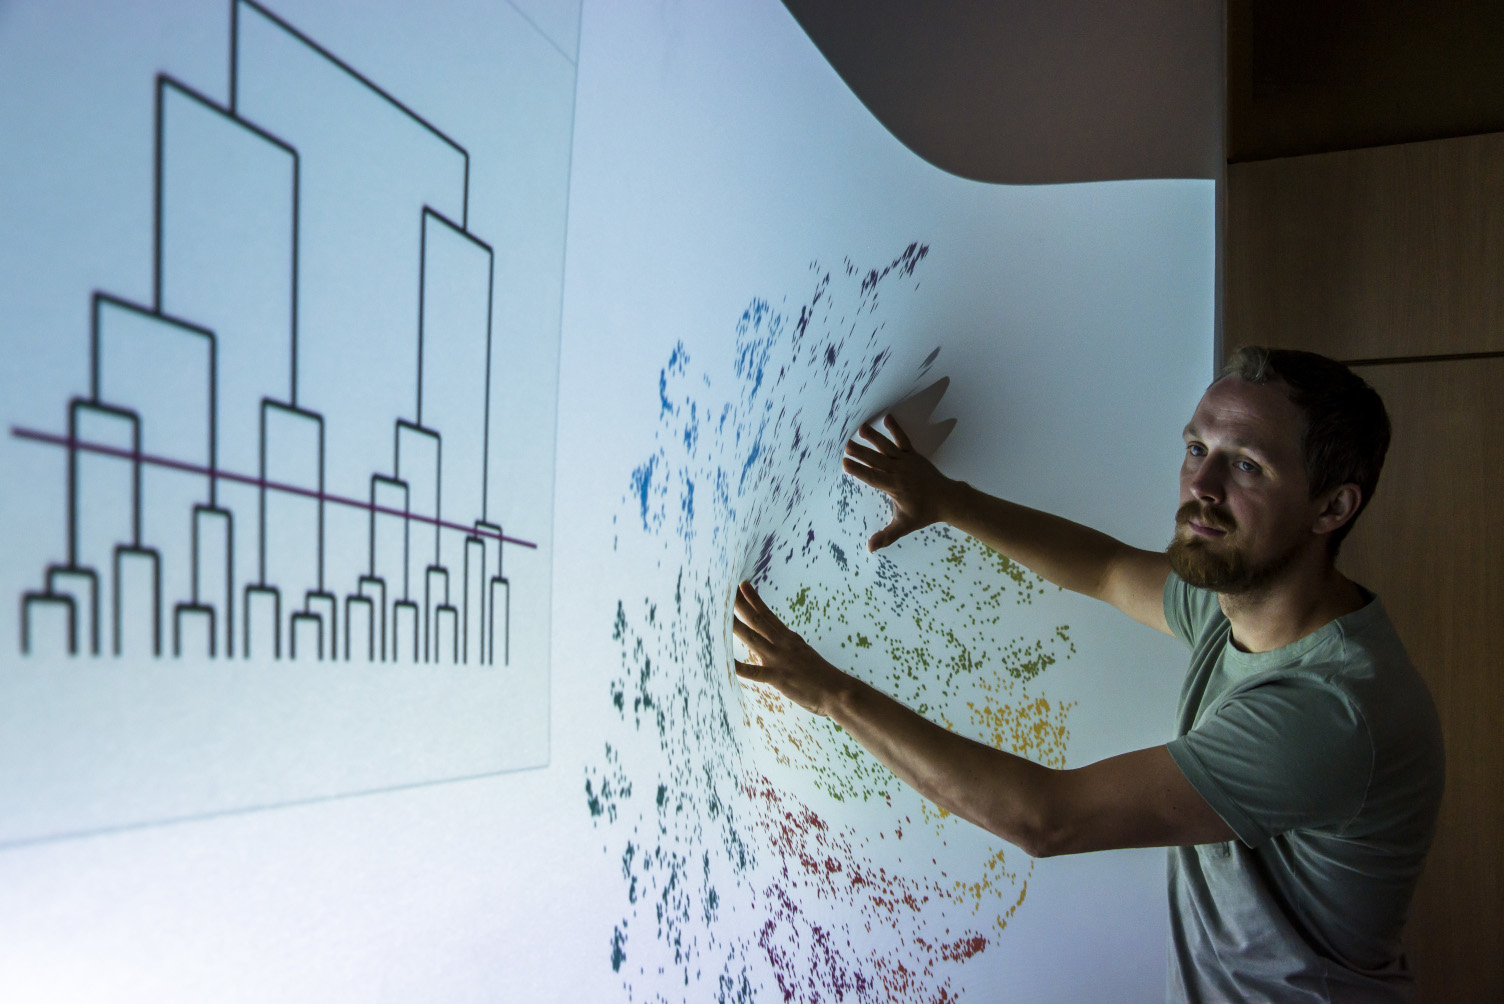 Image sequences used for data analysis in FlexiWall Big Data Layers application [9]
 Using vector field for physics simulation with the DepthTouch prototype [18]
Single-Touch 3D
The basic interaction with a touch display – a single touch – can easily be translated to Elastic Displays: The finger specifies a point on the surface (touch) respectively in space (Elastic Display). Single-touch interaction is achieved by evaluating the global extremum of the surface. This approach allows more sophisticated user interfaces and even mouse emulation to make traditional user interfaces available. However, it only allows a single touch and hence, there is a low expressiveness of the interaction. The Big Data Zoom application using FlexiWall [9] is the only application in our review relying solely on Single-Touch.
Multi-Touch 3D
The computation of local extrema of the depth image analysis achieves multi-touch interaction on an Elastic Display and interprets them as »multi-touch with an additional dimension« (cp. [6]). Hence, existing multi-touch gestures can be extended by evaluating the depth position of the interaction (cp. [6, 21]). As a result, full-fledged user interfaces are achieved. The range of possible interactions are described in Models: Interactions.
However, this approach requires a complex calibration procedure and due to the involved depth sensors, it is commonly not very stable and positional accuracy is rather low. Current technology requires smoothing procedures, which in return introduce considerable latency. However, several productive applications rely on Multi-Touch on the Elastic Display such as Deformable Workspace [23], eTable 3D-viewer [12], DepthTouch Product Browser [14] and Layered Map Exploration [16], and FlexiWall Data Exploration [13].
Interaction Layer
On the interaction level, we distinguish different styles of interaction that are closely related to the technological approaches described previously. Different interaction styles can be combined as shown by FlexiWall Data Exploration [13] (Zoom + Physics-Based) or DepthTouch Layered Map Exploration [16] (Layers + Zoom).
Layers
ith this interaction style, insights about different structural levels of an information space and relationships between them can be gained. This is primarily based on planar content that is organized in image sequences. Due to the simplicity of this approach, most of the reviewed applications use layer interaction: Khronos Movie Viewer [1], eTable 3D-viewer [12], ElaScreen 3D scene navigation and Time Domain [24], as well as FlexiWall Big Data Layers [9], Image Effects, Painting Explorer, and Map Viewer [15].
Zoom
With this interaction style, overview and detail techniques can be realized. This includes geometric zoom using gigapixel images and rich semantic zooms for abstract data, e. g. with magic lenses. FlexiWall Big Data Zoom [9], and Zoomable UI [17] use zoom as primary interaction style.
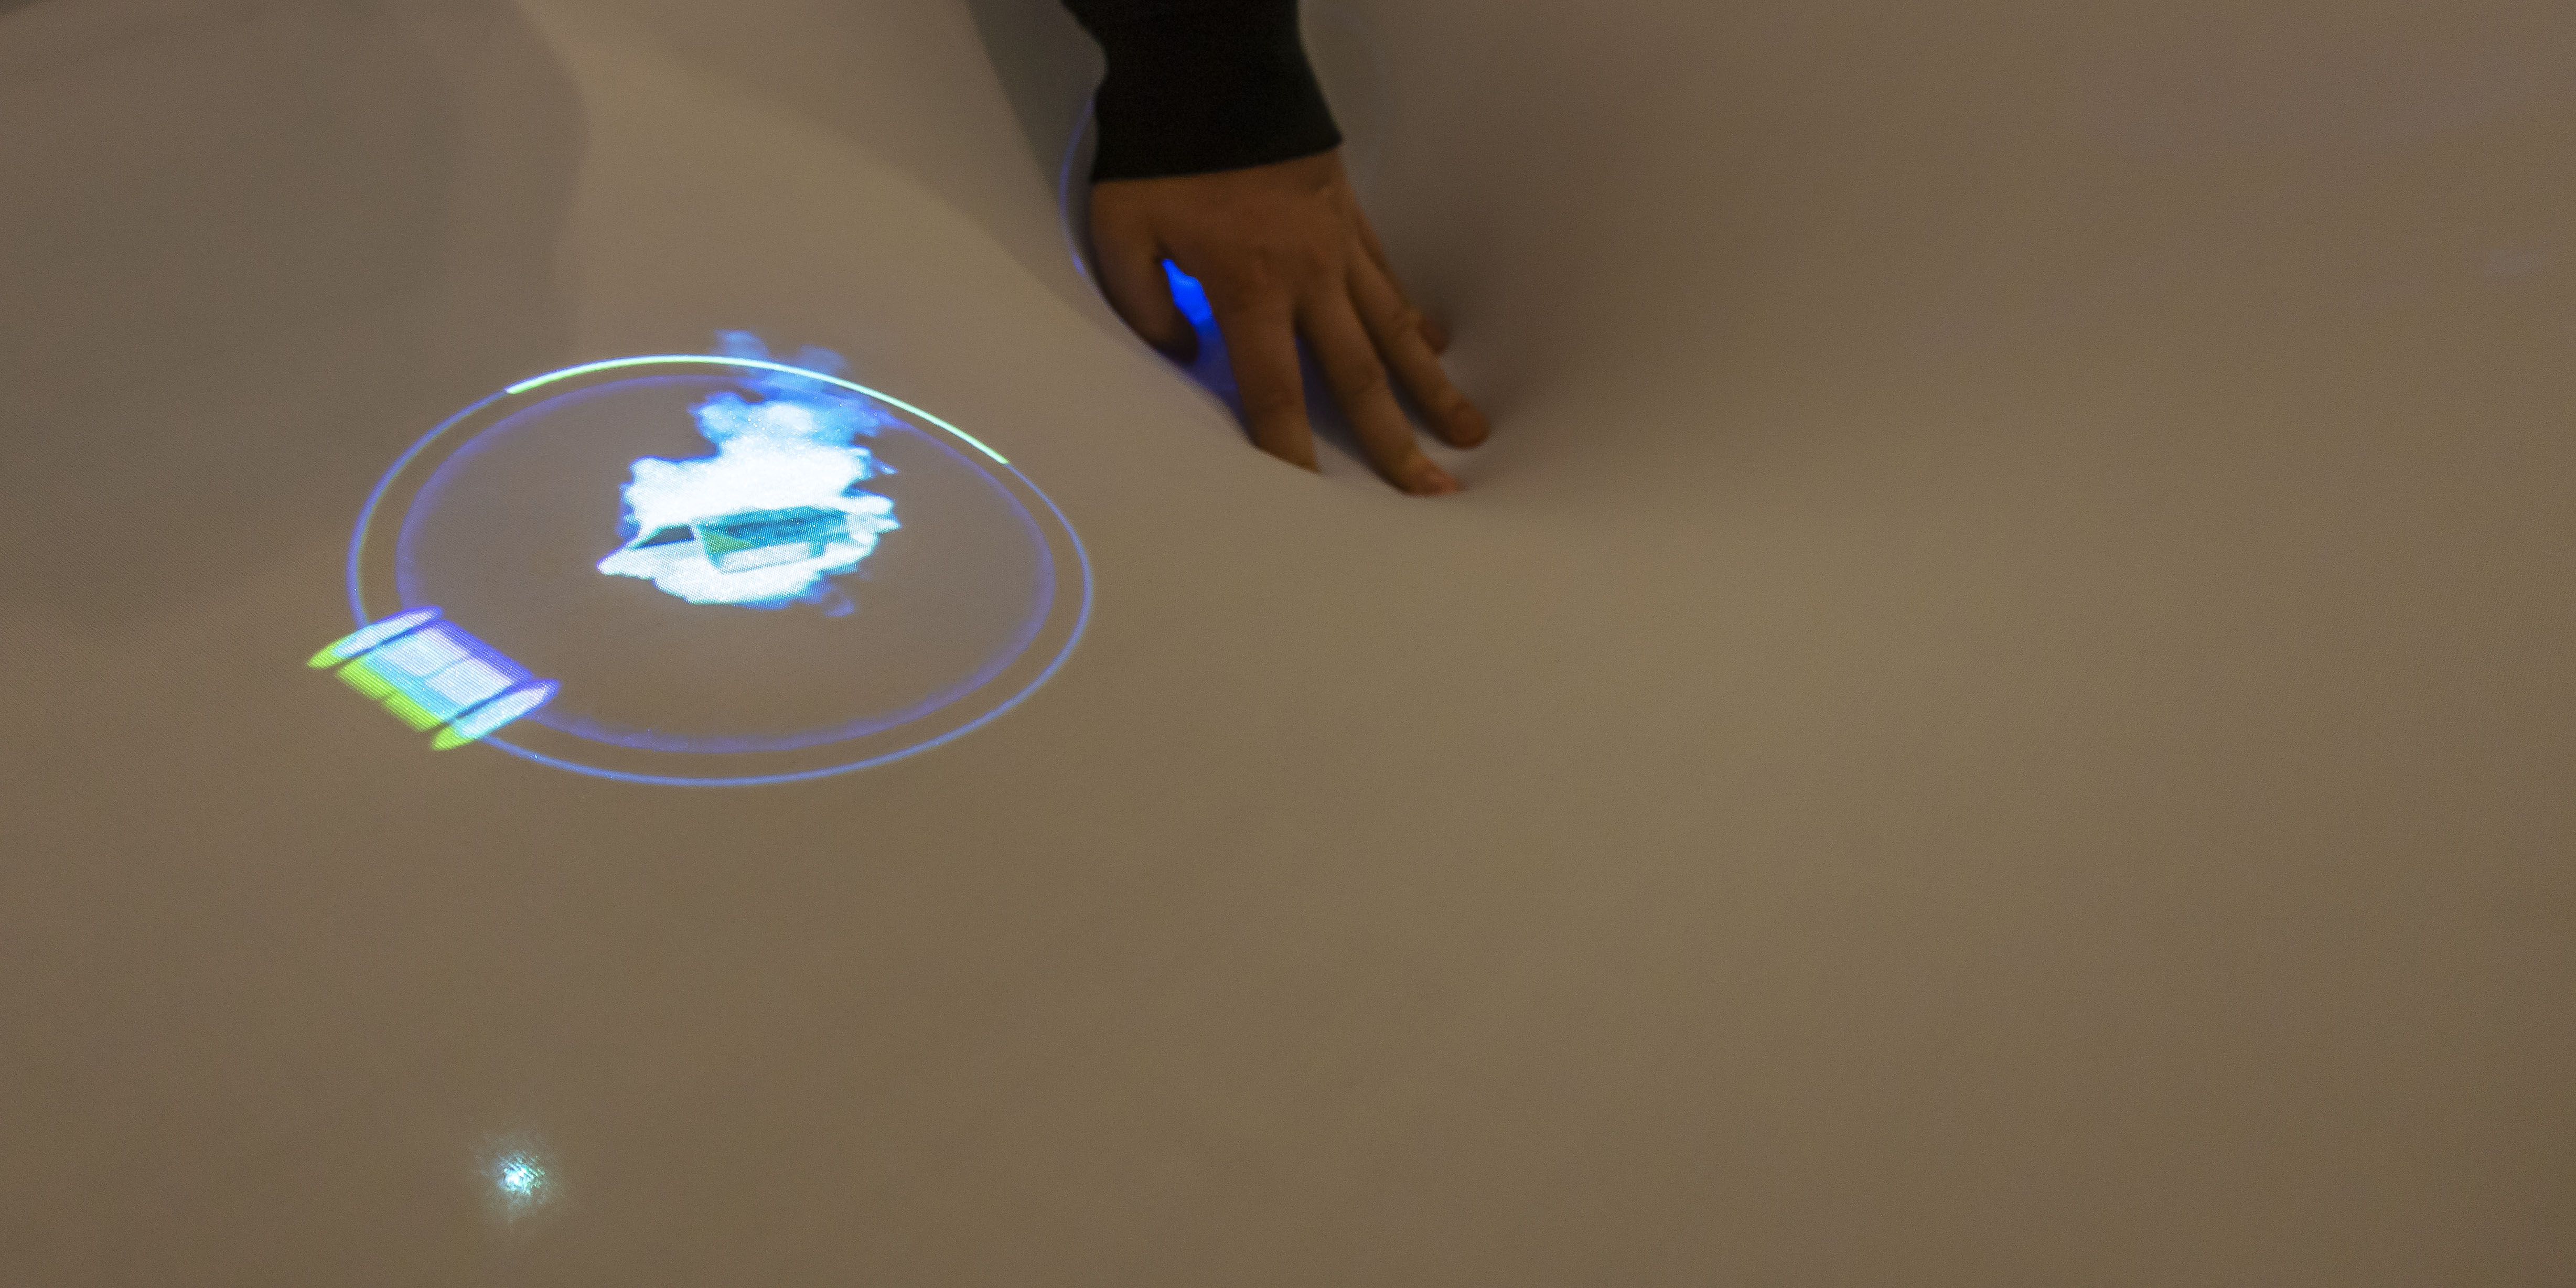
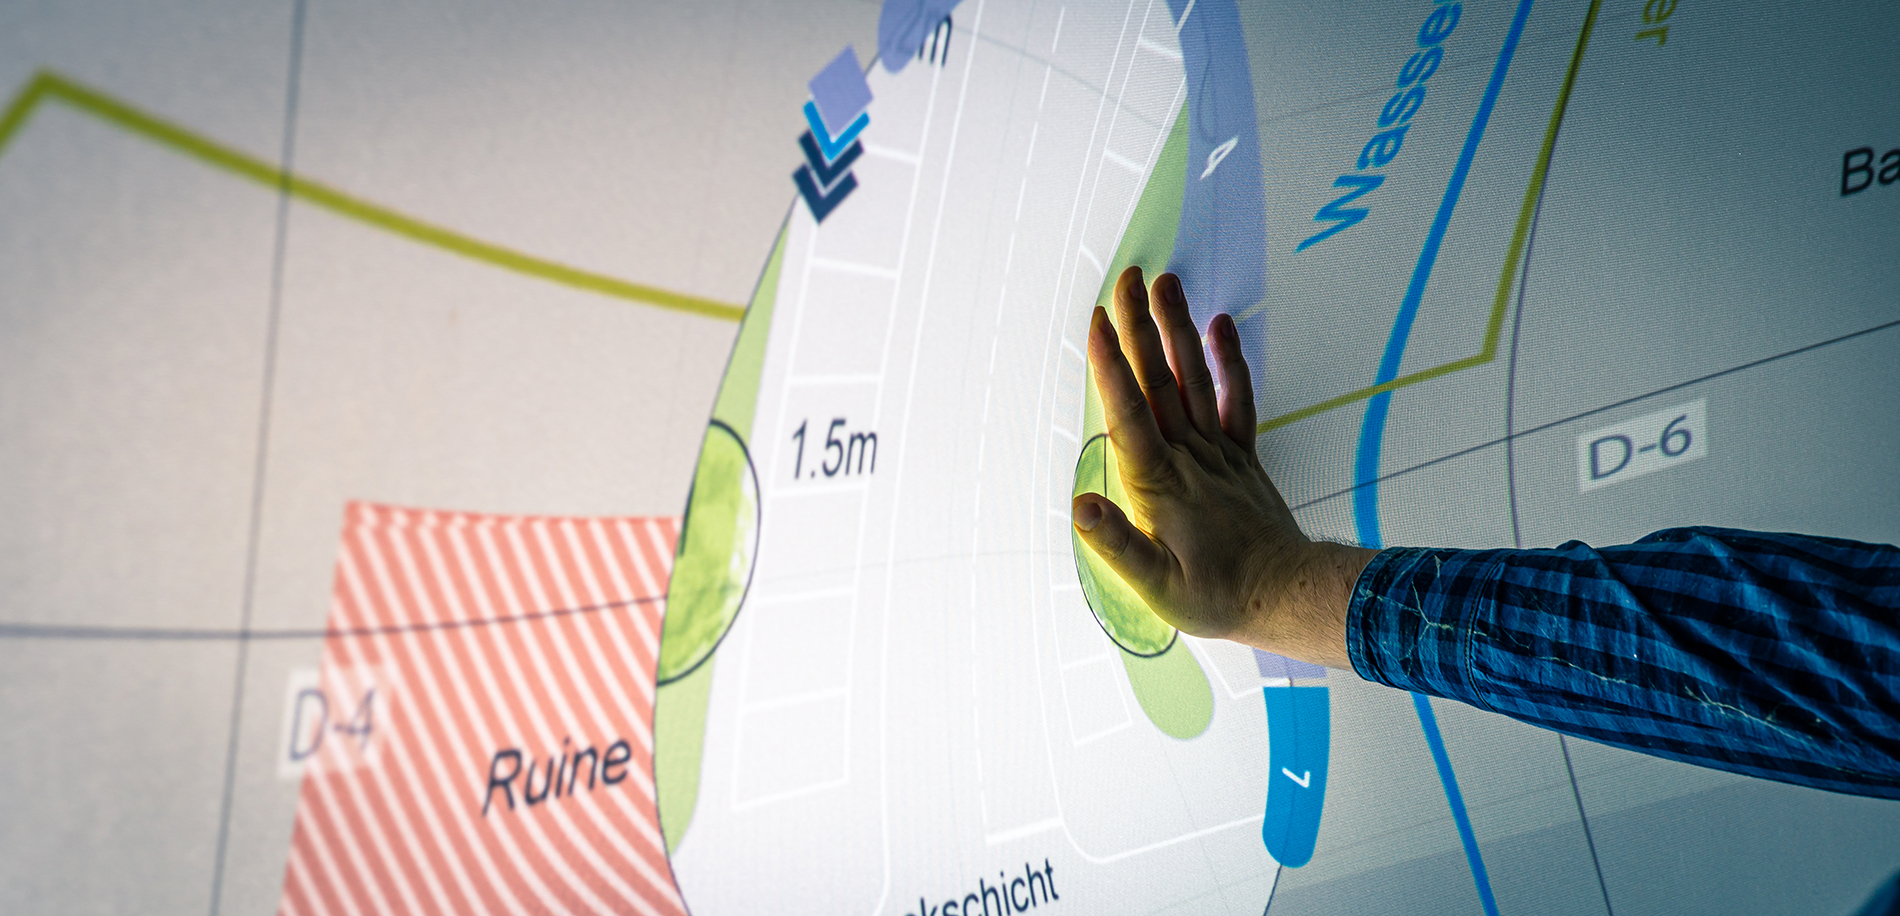 Example of a zoomable UI using maps and magic lenses in DepthTouch Layered Map Exploration [16]
 Concept for zoomable user interface in the context of mechanical engineering
Physics-based
Exploration of physical phenomena such as gravity or magnetism are realized with particle simulations and yield an intuitive physics-based interaction. Usage of physic-based metaphors is possible such as attraction and repulsion forces, gravity, movement, collision, or mass of objects. (cp. [8]) Examples for physics-based interaction are ElaScreen’s Graph Visualization [24], and the DepthTouch Prototype [18].
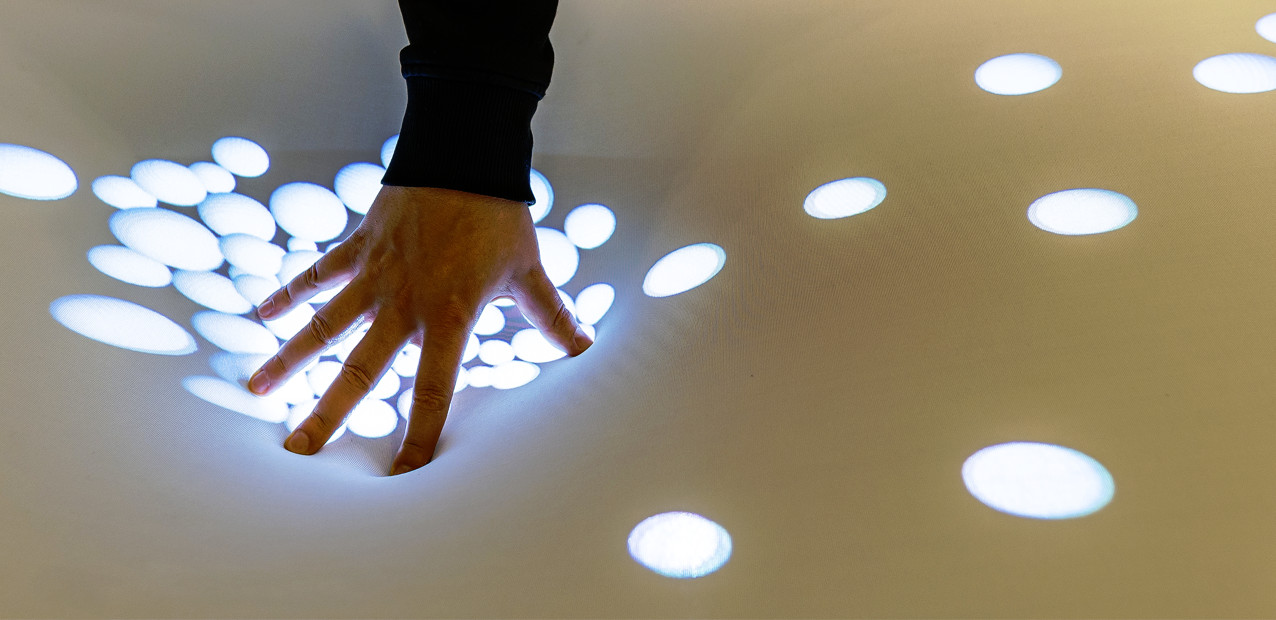 Physical gravity simulation based on the deformation of the elastic surface
 Using physical metaphors for controlling objects in a gaming scenario
Hybrid
Finally, hybrid approaches combine more than one interaction style, possibly also different technologies. For example, the combination of zoom and physics-based interaction allows using forces to filter and semantic zoom to visualize details (FlexiWall Data Exploration [13] and DepthTouch Product Browser [14]). Layers and physics-based interaction can exploit force-touch for navigation and layers to control animations on specific items. Layers and Zoomable UI can also be combined, e.g. when using magic lenses (DepthTouch Layered Map Exploration [16]).
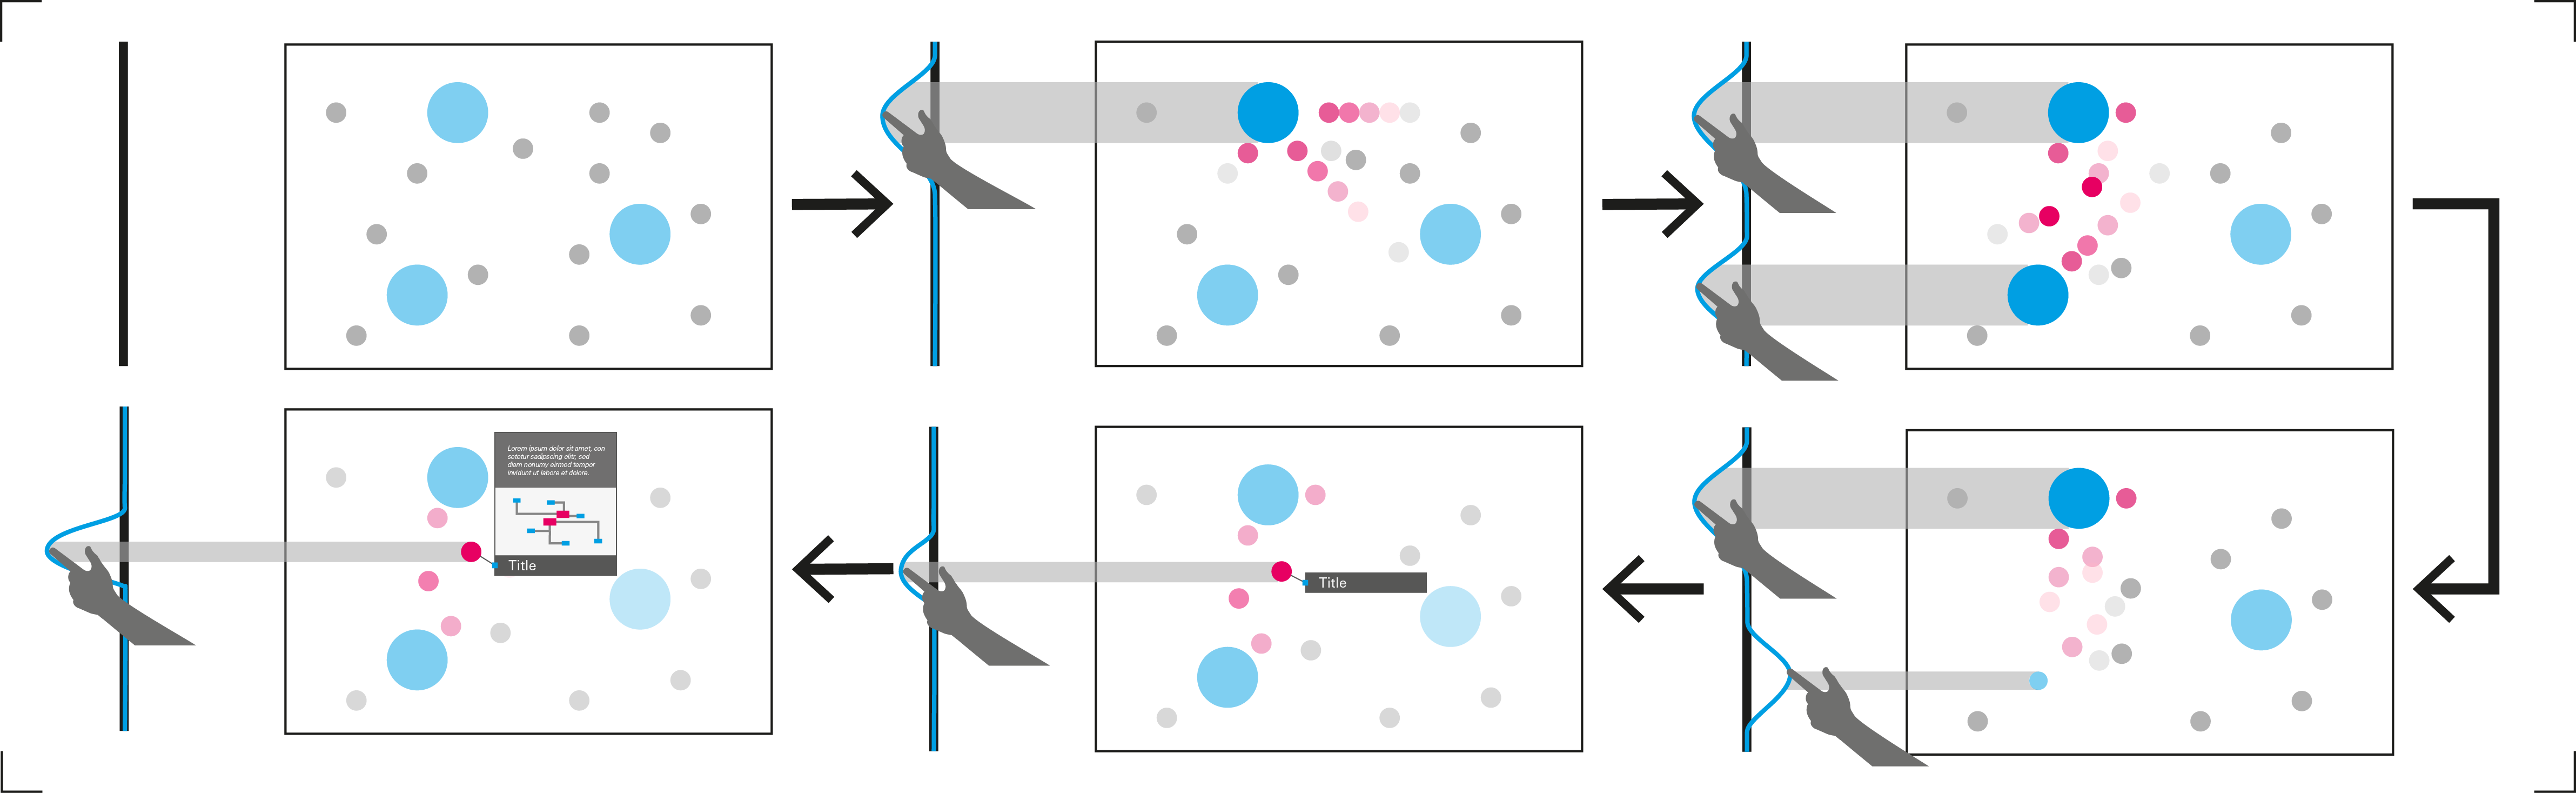 Concept for physics-based interaction an displaying information using zoomable UI techniques employed in DEEP [13]
 FlexiWall Data Exploration [13]
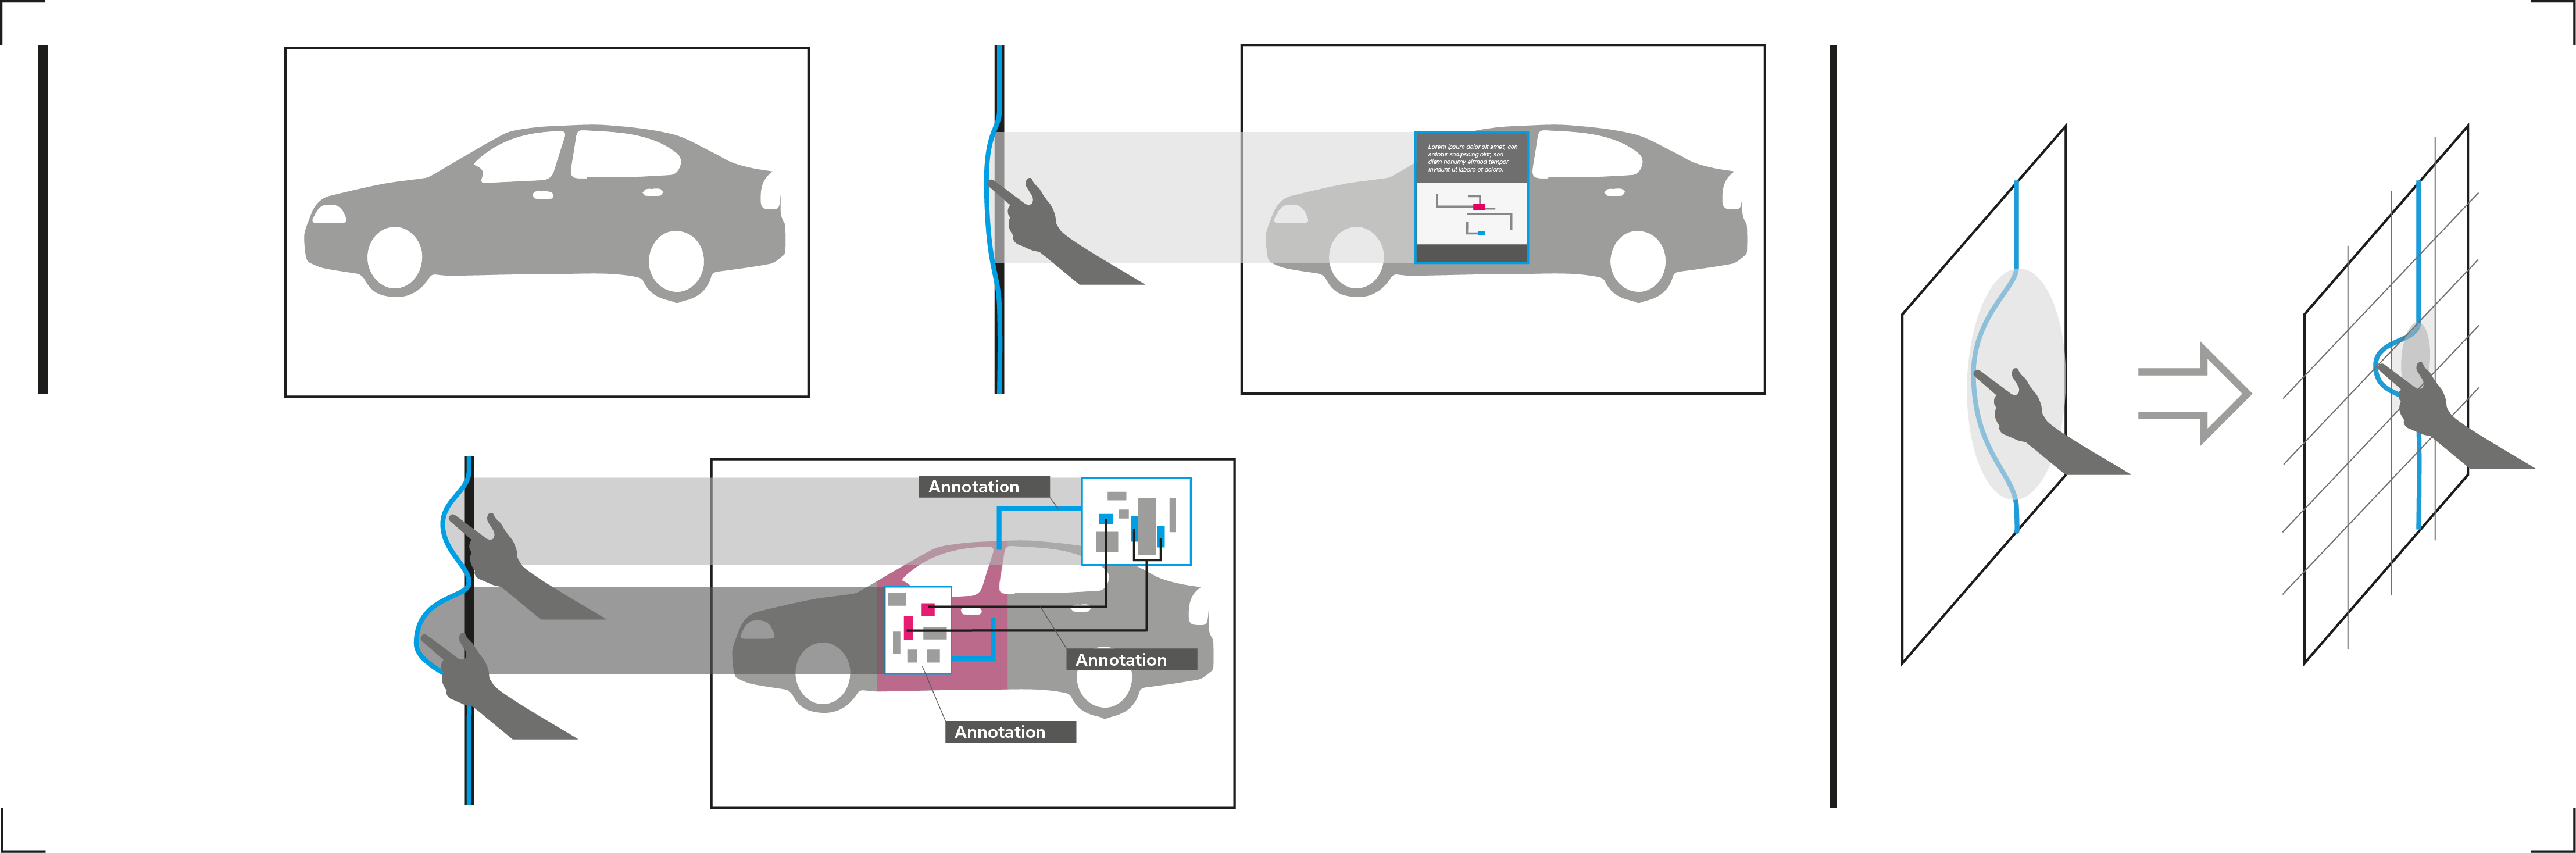
 DepthTouch Product Browser [14]
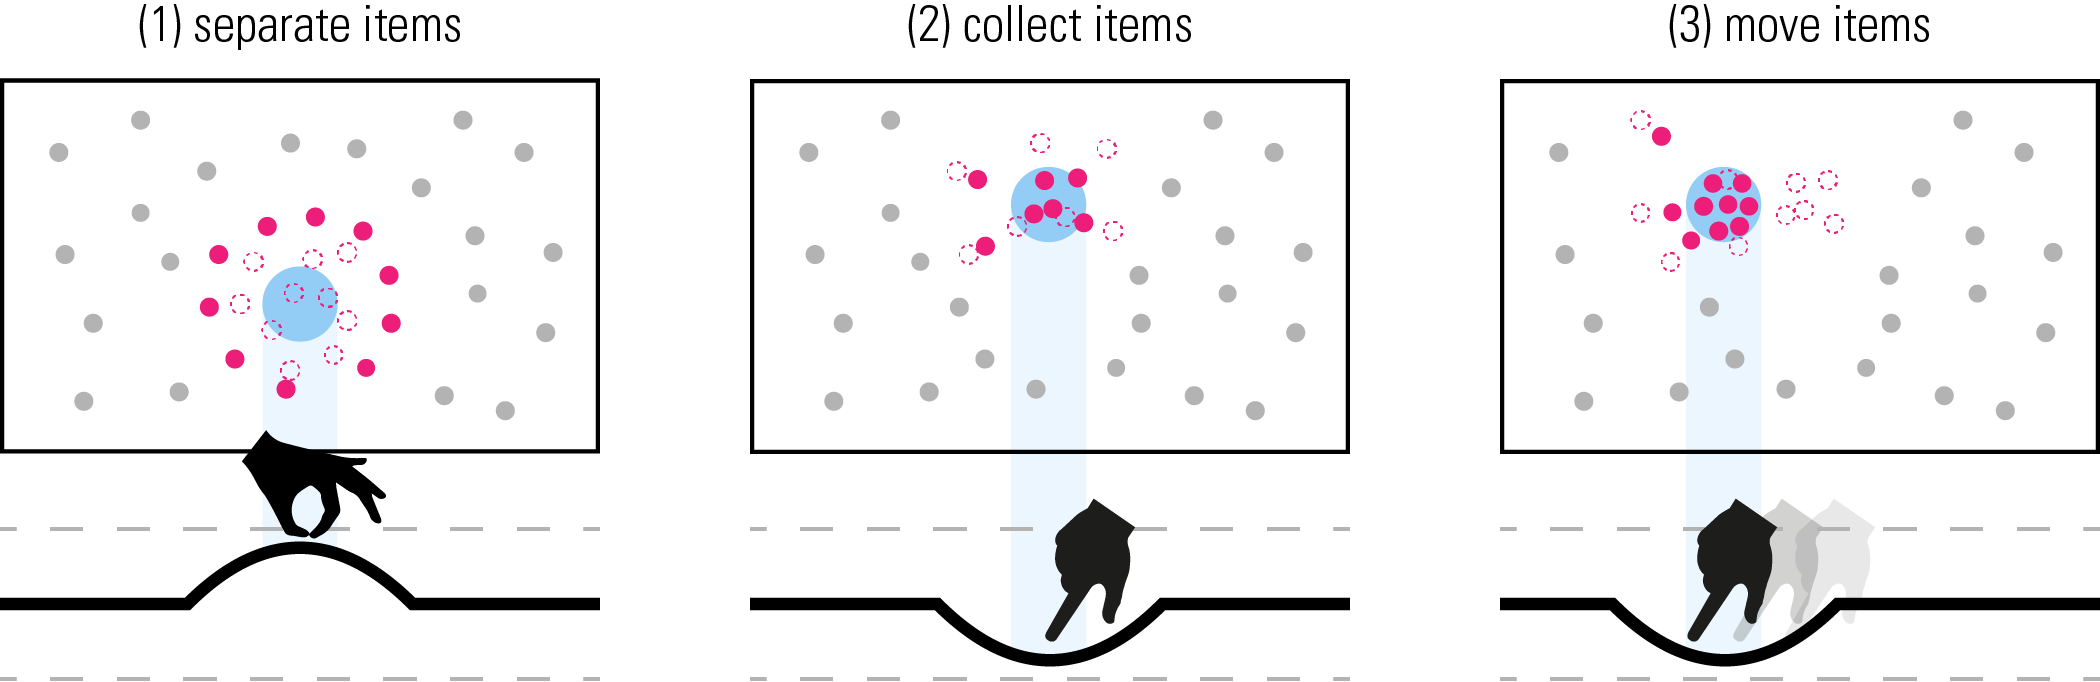 Concept for selecting items using physical interaction metaphors
Tasks
The most important level in the taxonomy is the actual task level. Our list consists of common tasks in HCI that have been realized successfully on Elastic Displays. For each of the task types, we mention general application domains.
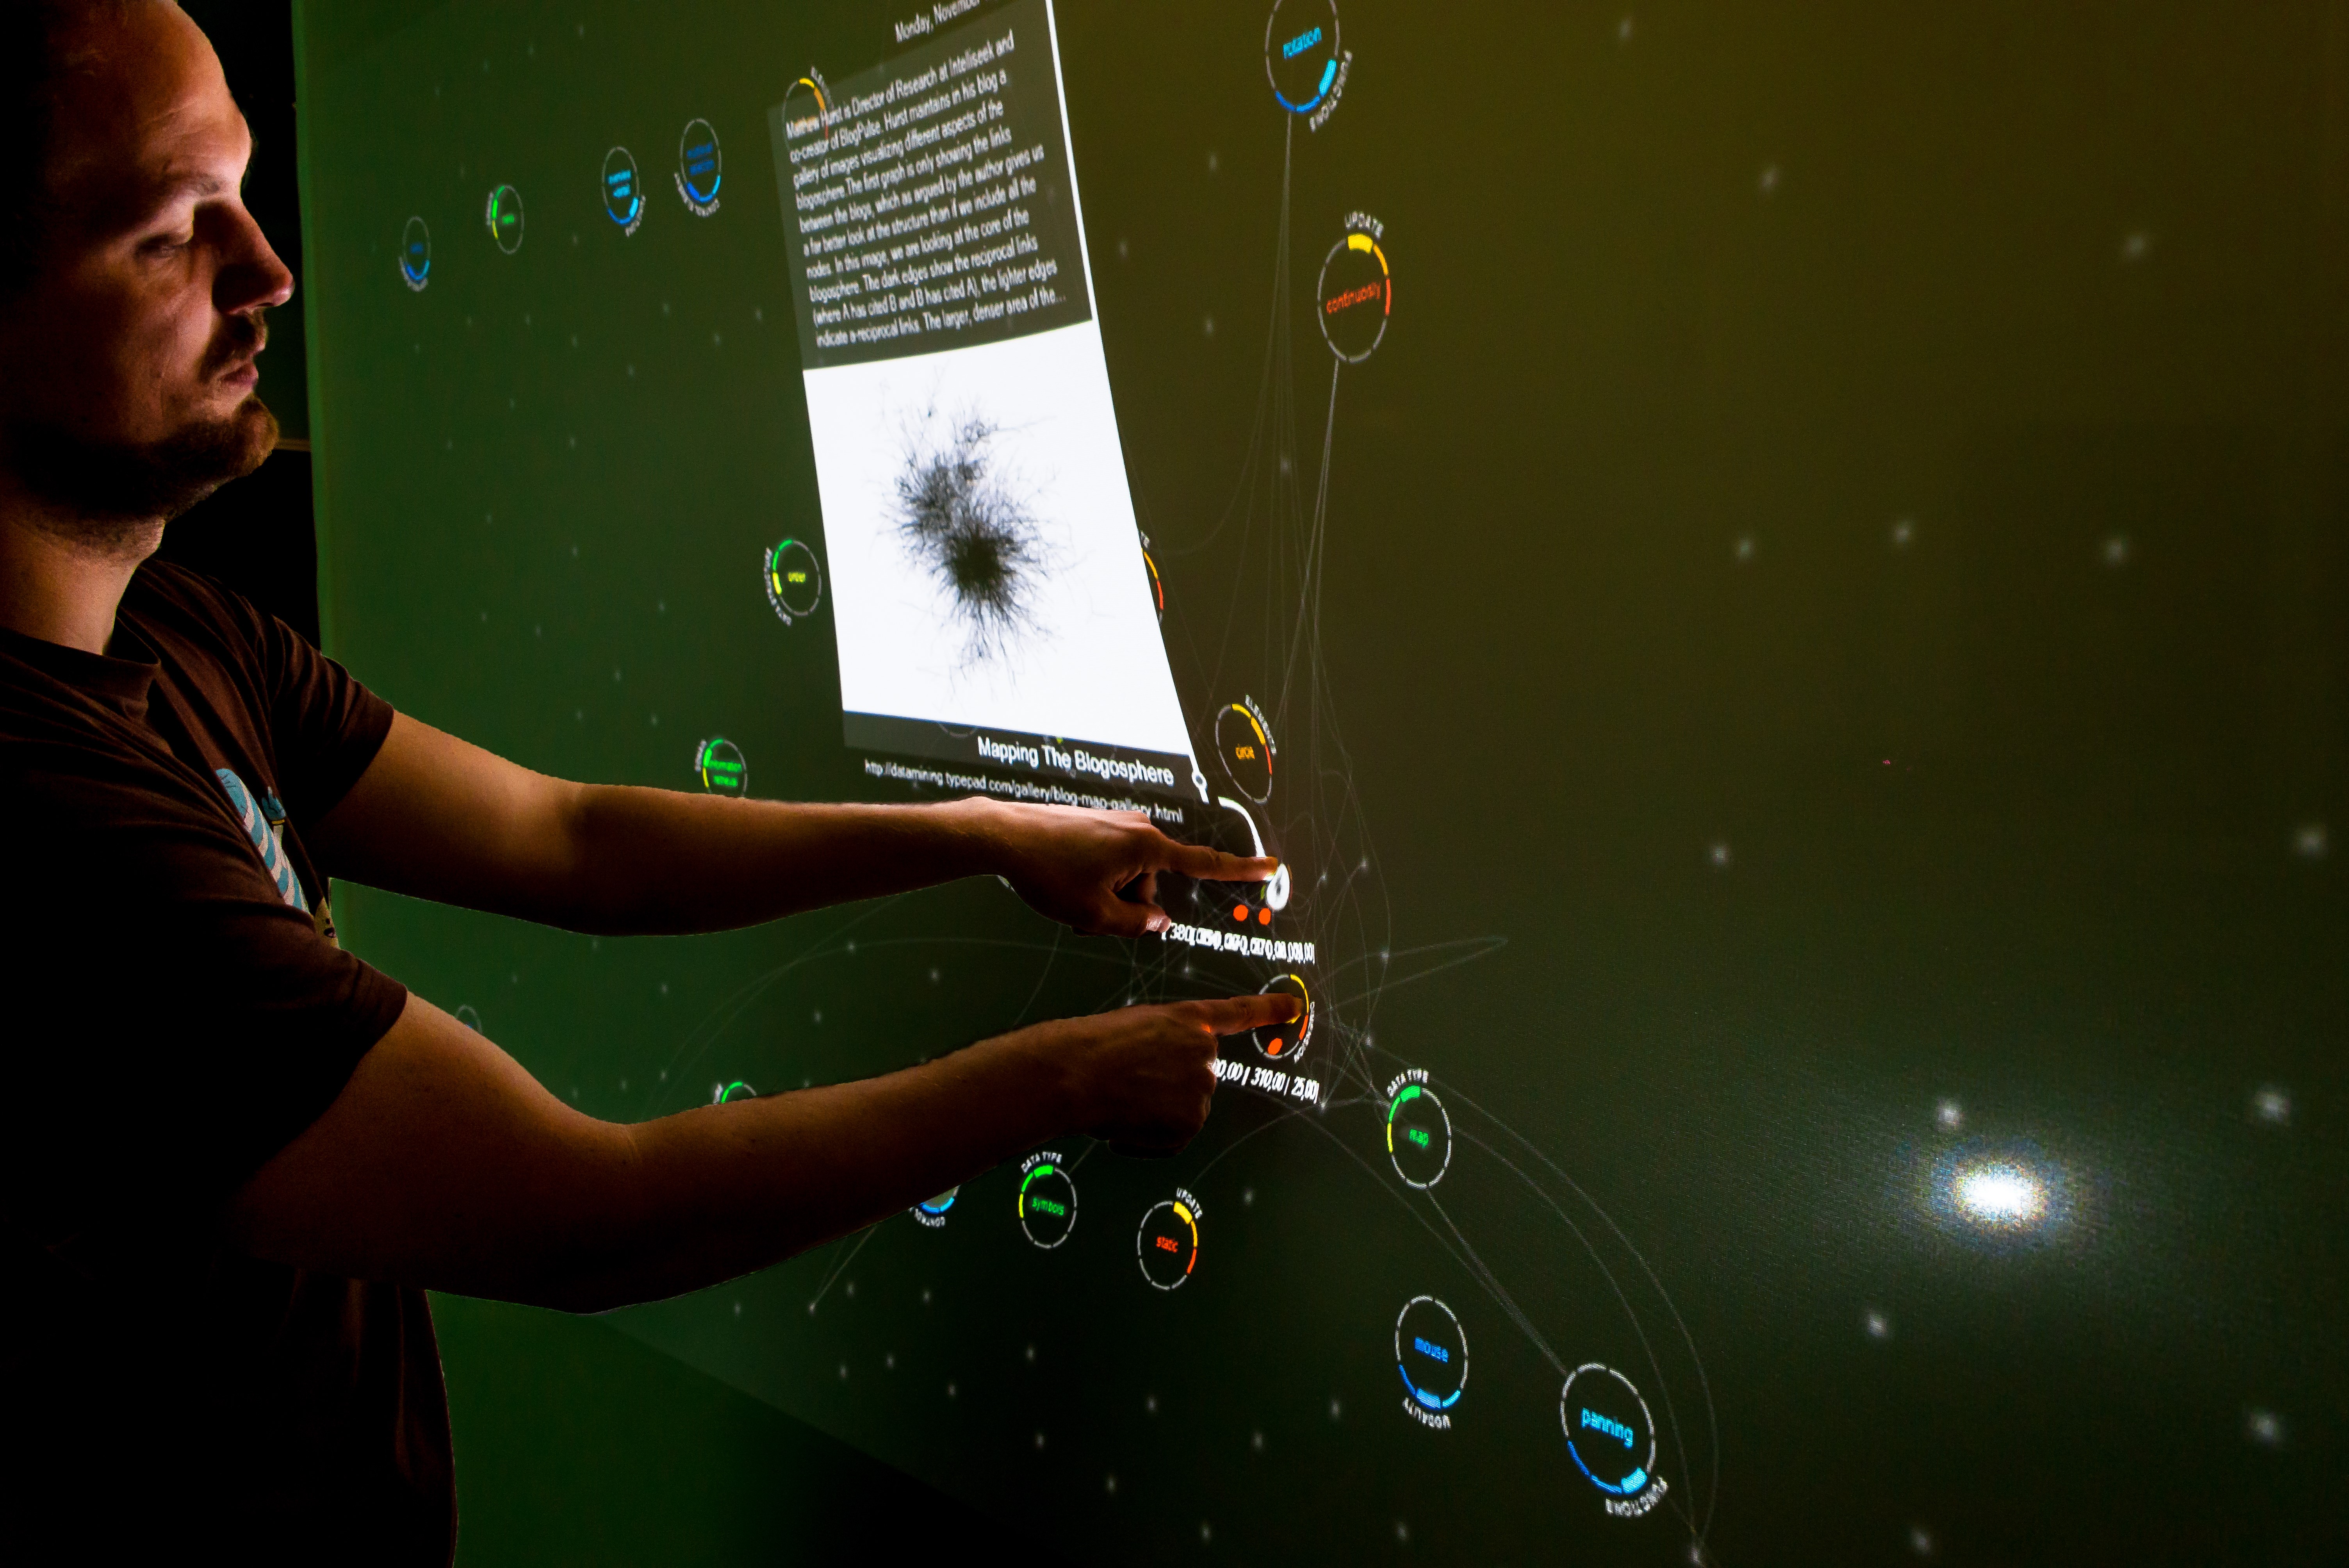
Discover Relationships
The most basic task that can be achieved in an application using an Elastic Display is to discover relationships in the available data. Intricate structures can be visualized, and relationships can be explored. Data visualizations all too often contain innumerable items with manifold dimensions and relationships. The resulting scatter plots or point clouds can be displayed as spatial networks using Elastic Displays. In museums or during exhibitions, Elastic Displays can be used to convey relationships very effectively in an appealing way.
Understand structures
Closely related to discovering relationships is the understanding of more complex structures in a data set. Using the haptic user interface of Elastic Displays for education is another usage scenario. Medicine or Geology are suitable knowledge domains where interaction with volumetric data is particularly interesting. By creating cutting planes, the location of objects, e. g. raw material deposits or abnormal tissues can be identified. The advantage of using Elastic Displays is the ability to experience the spatial location and distances more naturally. In general, the handling of volumetric data is more intelligible because the visual representation is facilitated by the haptic depth interaction using the Elastic Display.
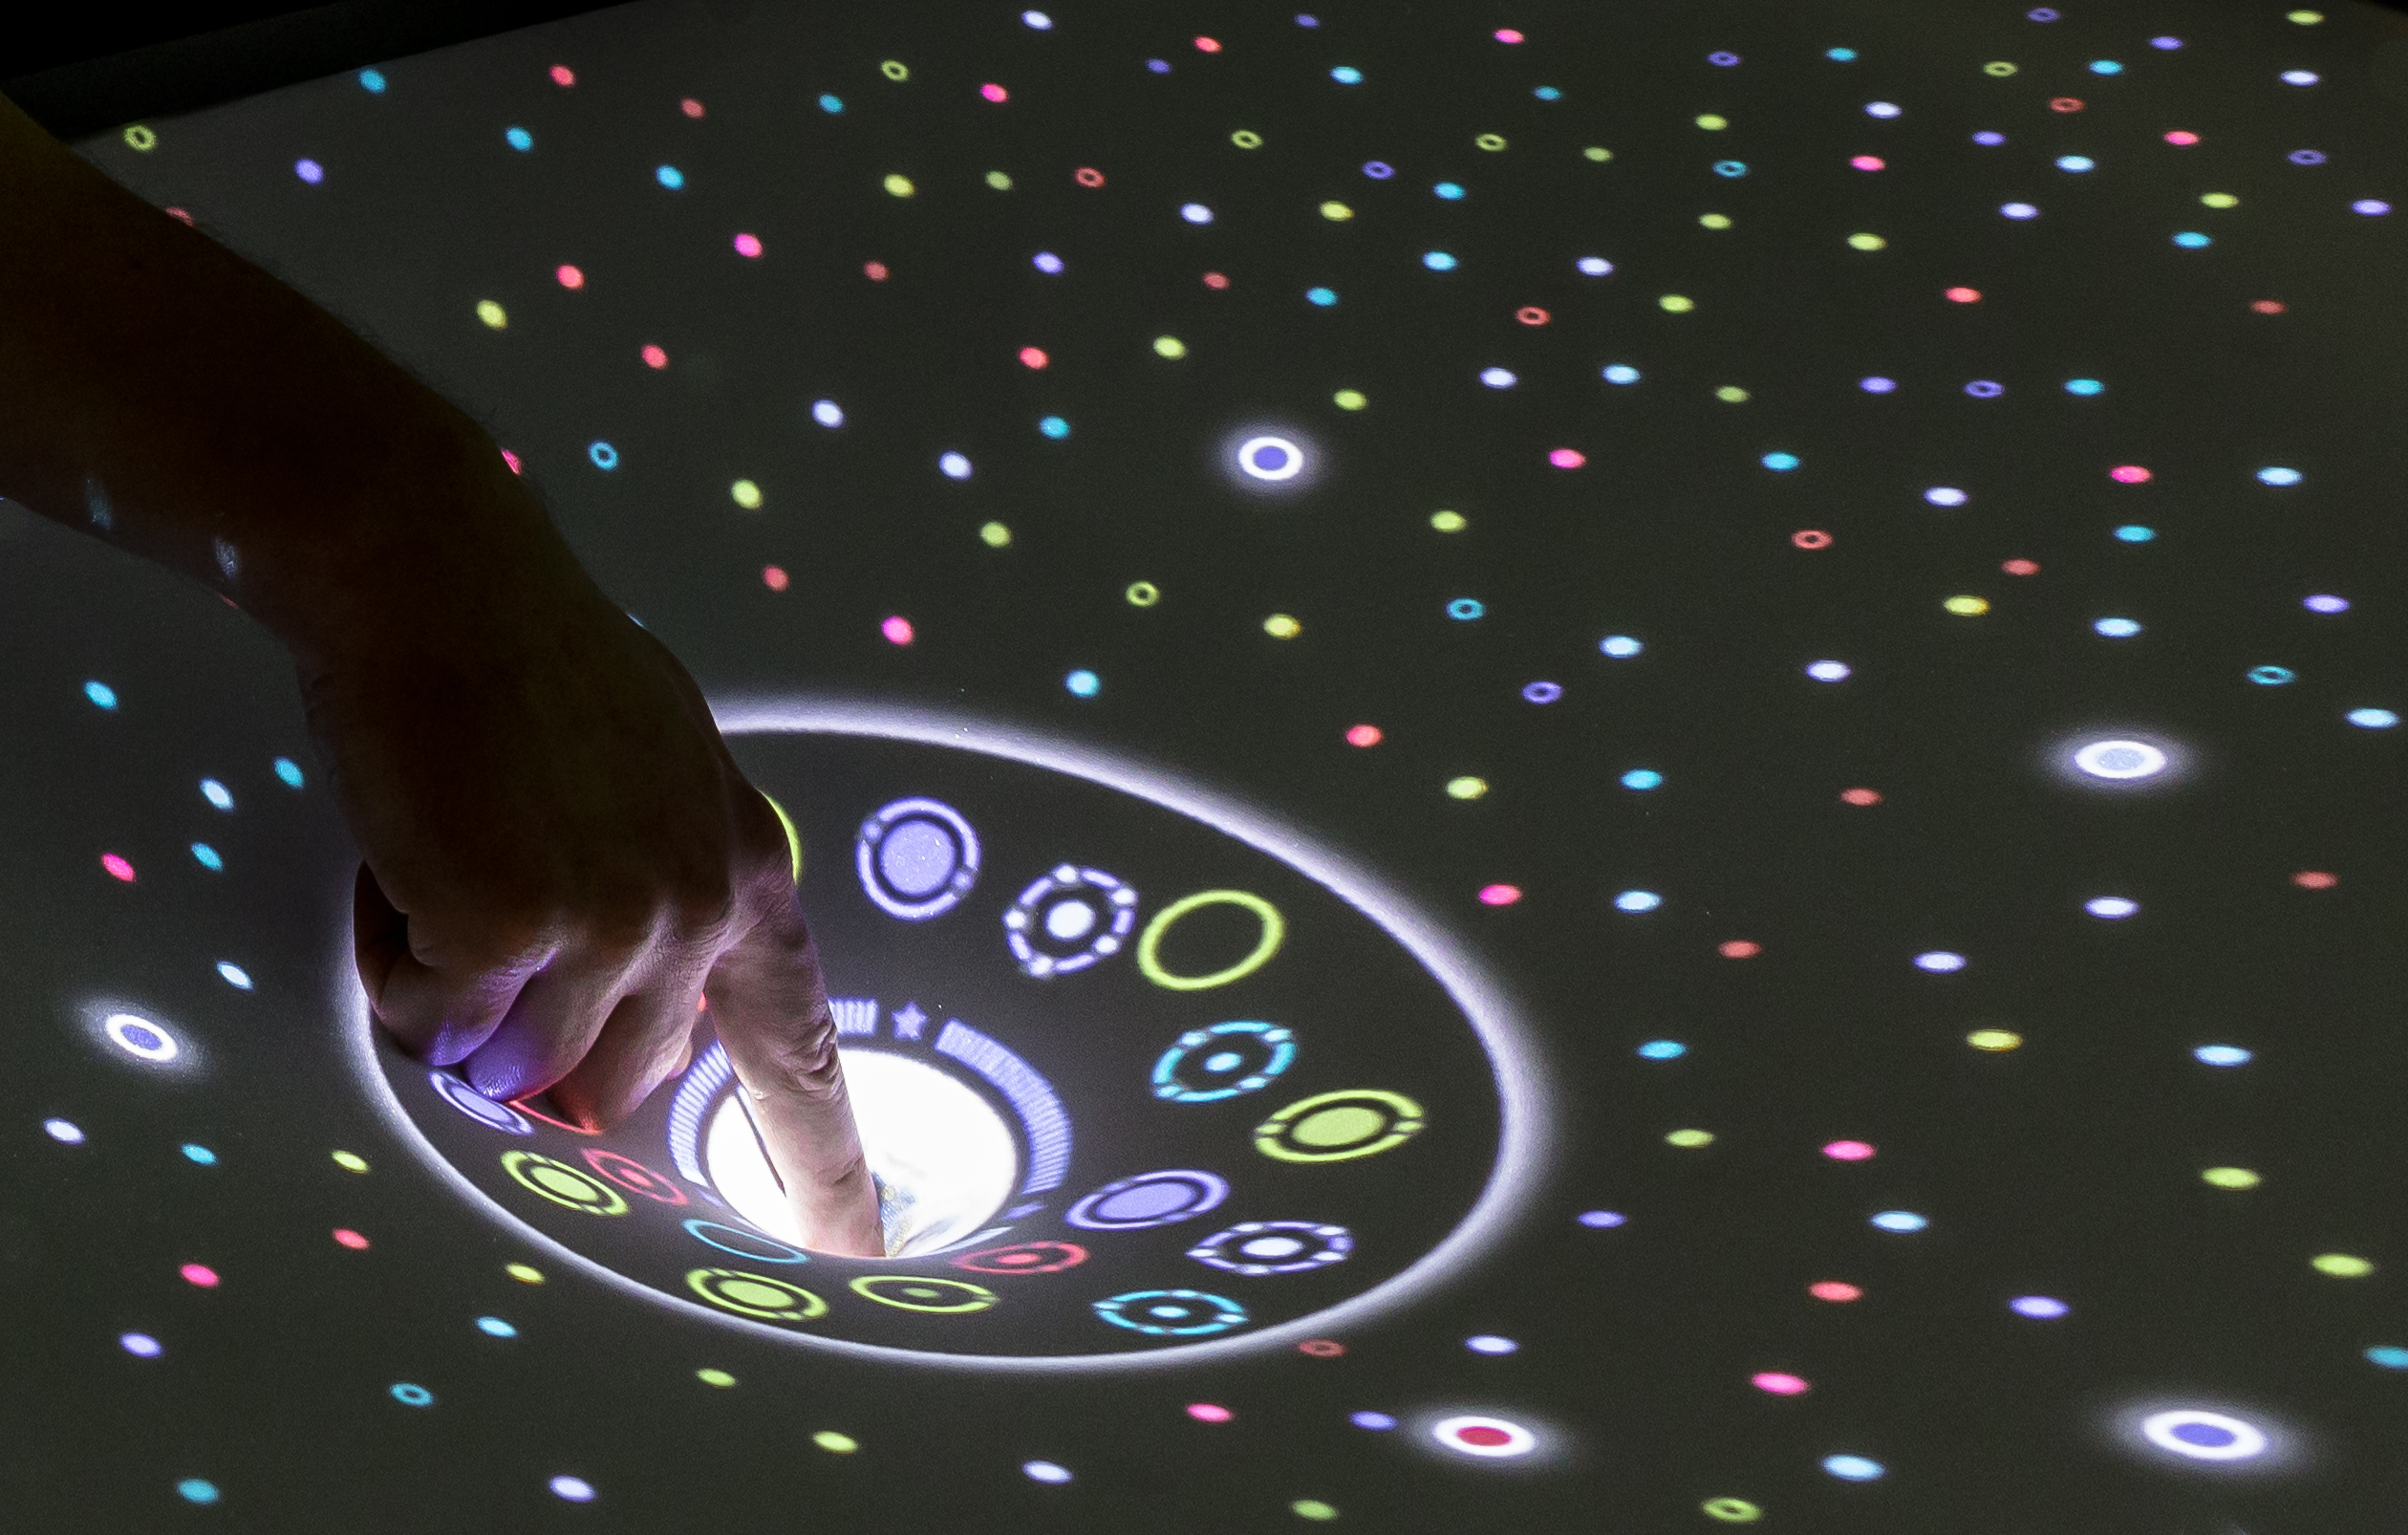
Search Items
With the different types of content, also search tasks become relevant. Both exploratory searches with vague search goals are possible as well as concrete searches with clear properties in mind [11]. Deforming the surface is beneficial for filtering or selecting subsets in the data, or gain an individual perspective on the data, e. g. by defining a cutting plane inside a 3D scatterplot.
Manipulate Data
Due to the ephemeral nature of the haptic interaction with Elastic Displays, the actual permanent manipulation of data items is a demanding task. However, this task is essential in domains such as product design that could benefit from the versatility of the surface deformation for complex data manipulations.
Make Decisions
Data visualization on Elastic Displays can facilitate decision-making processes. In urban development and architectural visualization, numerous maps and views exist that depict aspects relevant for construction planning (plans, ground plots, profiles, supply units, waste management, escape routes, energy plans, wiring diagrams, etc.). Relating this information to maps often results in massive visual clutter. Using semi-transparent plans is a common solution to this problem. Elastic Displays can be used to control the transparency of such information layers in the desired areas of the map. Hence, conflicts of the different plans (e. g. building and civil engineering drawing) can be identified without losing the overall view of the plan. Another promising application is informing the public about construction projects (civic participation), which contains all relevant and important information resulting in specific architectural decisions that would otherwise be difficult to explain.
Collaborative Work
Large Elastic Displays are suitable for teams to work on problems. This kind of collaborative work can encompass several of the previous tasks, which are carried out individually. For instance, in mechanical engineering, the visualization of schemata such as component diagrams, circuit diagrams, or flow diagrams can explain the setup of complex systems, which is often challenging. In particular, when highly detailed information about the system is necessary, users are often overwhelmed. Elastic Displays can provide zoomable user interfaces that allow natural adjustment of level of details. In the initial state, a clear and well-structured overview of the system and its component is provided. Further details of subsystems can be viewed using the deformation of the surface. The depth of the interaction determines the level of detail. In this way, system details can be explored without losing the context of the entire system. Since collaboration on specific problems is a very complex task, only few applications for Elastic Displays realize a collaborative approach to discuss clustering problems (so far).
Prototypes classified by the Taxonomy
The following plot displays how different prototypes from related work can be classified by the different dimensions of the taxonomy.

References
[1] Cassinelli, A. and Ishikawa, M. (2005): Khronos Projector. In: Donna Cox (Ed.): SIGGRAPH ‘05: ACM SIGGRAPH 2005 Emerging technologies. ACM SIGGRAPH 2005: Emerging technologies. Los Angeles, Kalifornien, USA, 31.07.2005. New York, NY, USA: ACM, pp. 10. DOI: 10.1145/1187297.1187308
[2] Cibrian, F. L., Peña, O., Ortega, D. and Tentori, M. (2017): BendableSound: An elastic multisensory surface using touch-based interactions to assist children with severe autism during music therapy. In: International Journal of Human-Computer Studies 107, pp. 22–37. DOI: 10.1016/j.ijhcs.2017.05.003
[3] Dand, D. and Hemsley, R. (2013): Obake: Interactions on a 2.5 D Elastic Display. In: Shahram Izadi, Aaron Quigley, Ivan Poupyrev and Takeo Igarashi (Ed.): UIST ‘13 Adjunct: Adjunct Publication of the 26th annual ACM Symposium on User Interface Software and Technology. ACM Symposium on User Interface Software and Technology. St. Andrews, UK, 8.-11.10.2013. New York, NY, USA: ACM, pp. 109–110. DOI: 10.1145/2508468.2514734
[5] FLUUR GmbH (Beutling, T., Dormann, D and Höh, L.) (2012): KREEK – Multitouch in 3D. https://vimeo.com/174664186
[4] Everyware (Bang, H. and Heo, Y.) (2011): Cloud Pink. https://everyware.kr/home/portfolio/cloud-pink/
[6] Franke, I. S., Müller, M., Gründer, T. and Groh, R. (2014): FlexiWall: Interaction in-between 2D and 3D Interfaces. In: Constantine Stephanidis (Ed.): HCI International 2014 - Posters’ Extended Abstracts. HCI International 2014: International Conference on Human-Computer Interaction. Crete, Greece, 22.06.2014-27.06.2014. Cham: Springer; Springer International Publishing (Communications in computer and information science, 434), pp. 415–420. DOI: 10.1007/978-3-319-07857-1_73
[7] Hilsing, S. (2010): Impress - A Flexible Display. http://www.silkehilsing.de/impress/blog/?cat=5
[8] *Jacob, R. J., Girouard, A., Hirshfield, L. M., Horn, M. S., Shaer, O., Solovey, E. T., and Zigelbaum, J.** (2008): **Reality-based Interaction: A Framework for Post-WIMP Interfaces. In Proceedings of the SIGCHI conference on human factors in computing systems (pp. 201–210). CHI ’08. Florence, Italy. New York,NY, USA: ACM. DOI: 10.1145/1357054.1357089.
[9] Kammer, D., Keck, M., Müller, M., Gründer, T. and Groh, R. (2017): Exploring Big Data Landscapes with Elastic Displays. In: Manuel Burghardt, Raphael Wimmer, Christian Wolff and Christa Womser-Hacker (Ed.): Mensch und Computer 2017 - Workshopband. Spielend einfach interagieren. Mensch und Computer 2017, 10. Workshop Be-Greifbare Interaktion (MCI-WS08). Regensburg, Germany, 10.09.2017. Bonn, Deutschland: Gesellschaft für Informatik e. V. (GI). DOI: 10.18420/muc2017-ws08-0342
[10] Kammer, D., Müller, M., Wojdziak, J. and Franke, I. S. (2018): New Impressions in Interaction Design: A Task Taxonomy for Elastic Displays. In: i-com 17 (3), S. 247–255. DOI: 10.1515/icom-2018-0021.
[11] Keck, M., Herrmann, M., Both, A., Gaertner, R. and Groh, R. (2013): Improving Motive-Based Search: Utilization of Vague Feelings and Ideas in the Process of Information Seeking Proceedings of the First International Conference on Distributed, Ambient, and Pervasive Interactions – Volume 8028. New York, NY, USA : Springer. DOI: 10.1007/978-3-642-39351-8_48
[12] Kingsley, P., Rossiter, J. and Subramanian, S. (2012): eTable: A Haptic Elastic Table for 3D Multi-touch Interactions
[13] Müller, M., Gründer, T. and Groh, R. (2015): Data Exploration on Elastic Displays using Physical Metaphors. In: Alison Clifford, Miguel Carvalhais and Mario Verdicchio (Ed.): xCoAx 2015: Proceedings of the Third Conference on Computation, Communication, Aesthetics and X. xCoAx 2015: Computation, Communication, Aesthetics & X. Glasgow, UK, 25.06.2015 - 26.26.2015, S. 111–124. https://core.ac.uk/download/pdf/30733117.pdf#page=112
[14] Müller, M., Keck, M., Gründer, T., Hube, N. and Groh, R. (2017): A Zoomable Product Browser for Elastic Displays. In: Luísa Ribas, André Rangel, Mario Verdicchio and Miguel Carvalhais (Ed.): xCoAx 2017: Proceedings of the Fifth Conference on Computation, Communication, Aesthetics and X. xCoAx 2017: 5th Conference on Computation, Communication, Aesthetics & X. Lisbon, Portugal, 06.07.2017 - 07.07.2017, S. 127–136. http://2017.xcoax.org/pdf/xcoax2017-muller.pdf
[15] Müller, M., Knöfel, A., Gründer, T., Franke, I. and Groh, R. (2014): FlexiWall: Exploring Layered Data with Elastic Displays. In: Raimund Dachselt, Nicholas Graham, Kasper Hornbæk und Miguel Nacenta (Ed.): ITS ‘14: Proceedings of the Ninth ACM International Conference on Interactive Tabletops and Surfaces. TS ‘14: Interactive Tabletops and Surfaces. Dresden, Germany, 16.11.2014 - 19.11.2014. New York, NY, USA: ACM, pp. 439–442. DOI:10.1145/2669485.2669529
[16] Müller, M., Lier, E., Groh, R. and Hannß, F. (2020): A Tangible Concept for Layered Map Visualizations: Supporting on-site Civil Engineering Construction Consultations using Elastic Displays. In: Christian Hansen, Andreas Nürnberger and Bernhard Preim (Ed.): Mensch und Computer 2020 - Workshopband. Mensch und Computer 2020, 13. Workshop Be-greifbare Interaktion (MCI-WS06). Magdeburg, Germany, 06.09.2020. Bonn, Deutschland: Gesellschaft für Informatik e. V. (GI). DOI: 10.18420/muc2020-ws121-368
[17] Müller, M., Lier, E. and Gründer, T. (2018): Zoomable User Interfaces für Elastic Displays. In: Raimund Dachselt and Gerhard Weber (Ed.): Mensch und Computer 2018 - Workshopband. Mensch und Computer 2018, 11. Workshop Be-greifbare Interaktion (MCI-WS05). Dresden, Deutschland, 02.09.2018. Bonn, Germany: Gesellschaft für Informatik e. V. (GI). DOI: 10.18420/muc2018-ws05-0502
[18] Peschke, J., Göbel, F., Gründer, T., Keck, M., Kammer, D. and Groh, R. (2012): DepthTouch: An Elastic Surface for Tangible Computing. In: Genny Tortora, Stefano Levialdi and Maurizio Tucci (Ed.): AVI ‘12: Proceedings of the International Working Conference on Advanced Visual Interfaces. AVI’12: International Working Conference on Advanced Visual Interfaces. Capri, Italy, 21.05.2012 - 25.05.2012. New York, NY, USA: ACM, pp. 770-771. DOI: 10.1145/2254556.2254706
[19] Sahoo, D. R., Hornbæk, K. and Subramanian, S. (2016): TableHop. In: Jofish Kaye, Allison Druin, Cliff Lampe, Dan Morris and Juan Pablo Hourcade (Ed.): Proceedings of the 2016 CHI Conference on Human Factors in Computing Systems. CHI’16: CHI Conference on Human Factors in Computing Systems. San Jose, California, USA, 07.05.2016 - 12.05.2016. New York, NY, USA: ACM, pp. 3767–3780. DOI: 10.1145/2858036.2858544
[20] Shneiderman, B. (1996): The eyes have it: A task by data type taxonomy for information visualizations. In Visual Languages, 1996. Proceedings., IEEE Symposium on, IEEE, 336–343. DOI: 10.1109/VL.1996.545307
[21] Troiano, G. M., Pedersen, E. W. and Hornbæk, K. (2014): User-defined Gestures for Elastic, Deformable Displays. In: Paolo Paolini and Franca Garzotto (Ed.): AVI ‘14: Proceedings of the 2014 International Working Conference on Advanced Visual Interfaces. AVI’ 14: International Working Conference on Advanced Visual Interfaces. Como, Italy, 27.05.2014 - 29.05.2014. New York, NY, USA: ACM, pp. 1–8. DOI:10.1145/2598153.2598184
[22] Vazquez, Vi., Cibrian, F. L. and Tentori, M. (2019): StretchyStars: a multitouch elastic display to support cooperative play among preschoolers. In: Pers Ubiquit Comput 23 (1), S. 99–115. DOI: 10.1007/s00779-018-1179-5
[23] Watanabe, Y., Cassinelli, A., Komuro, T., and Ishikawa, M. (2008): The Deformable Workspace: a Membrane between Real and Virtual Space. In: 2008 3rd IEEE International Workshop on Horizontal Interactive Human Computer Systems. 2008 3rd IEEE International Workshop on Horizontal Interactive Human Computer Systems. Amsterdam, Netherlands, 01.10.2008 - 03.10.2008. Institute of Electrical and Electronics Engineers. Piscataway, NJ: IEEE, pp. 145–152. DOI=10.1109/tabletop.2008.4660197
[24] Yun, K., Cho, S., Song, J., Bang, H. and Youn, K. (2013): ElaScreen: Exploring Multi-dimensional Data using Elastic Screen. In: Wendy E. Mackay, Stephen Brewster and Susanne Bødker (Ed.): CHI ‘13 Extended Abstracts on Human Factors in Computing Systems. CHI ‘13: CHI Conference on Human Factors in Computing Systems. Paris, France, 27.04.2013 - 02.05.2013. New York, NY, USA: ACM, pp. 1311–1316. DOI: 10.1145/2468356.2468590