
Touch Detection
Table of Contents
- Introduction
- Signal Interference
- Implicit vs. explicit extrema
- Extremum Classification
- Identification of Touch
Introduction
Touch detection is based on the identification of local maxima by calculating the partial derivatives in the x and y directions, and builds directly upon the calculation of the vector field. Within this vector field, the system searches for a change in the sign of the individual components of the vectors.
Signal Interference
One challenge here is the noise behaviour of the sensor signal. Without filtering, a large number of local extreme values can be observed. To remedy this signal interference, three fundamental steps are taken:
- Pre-processing and filtering: The data is restricted to a specific range of values in all three spatial axes, including the masking of irrelevant areas; the values are then filtered.
- Threshold value for maximum angular deviations of the vectors in the vector field: Manual deformation produces uniform changes in the vectors; any remaining peaks are filtered out by this threshold value.
- Temporal stabilisation: The calculated position values of the extrema are generally numerically unstable due to sensor noise. Depth points are assigned a confidence value, which increases at each measurement time point at which the corresponding position value has moved less than a predefined distance in the lateral direction; the depth value is also taken into account to a lesser extent. Values with a confidence value below a configurable threshold are also filtered out.
Implicit vs. explicit extrema
The detection of contact points based on local extrema leads to another problem inherent in the principle: once there are two or more contact points, additional, ‘implicit’ extrema arise: between two minima there is a maximum, and between three minima there may be several maxima. The complexity of this problem increases with the number of pressure points, making it difficult to determine which extreme value was generated by the user and which by the fabric stretched between them.
One possible approach involves simulating the fabric and comparing it with the depth image. However, this is difficult to achieve in real time and requires precise modelling of the fabric’s material properties. Another approach involves additional finger recognition based on the shadow visible on the infrared image through the translucent fabric surface. This technical concept is comparable to the optical recognition of fingers and objects on interactive multi-touch surfaces. Its feasibility depends heavily on the ambient lighting and the projected content. Recognition is possible in backlit conditions and with homogeneous projection content; in other cases, recognition is highly unreliable – particularly where there is stray light or insufficient ambient light.
In addition to technical concepts, a heuristic approach is also useful, although this may entail certain limitations in terms of interaction. A simple heuristic is based on the assumption that, on one side of the fabric (relative to the normal plane), only one type of extremum is interpreted as a user interaction: from the sensor’s perspective, for example, all pressed-in points are local minima, whilst all pulled-out points are local maxima. Under this definition, it follows that any extreme values where the surrounding depth values have a greater relative distance from the surface should be ignored. This concept offers a simple and robust approach that is sufficient, at least for multi-touch detection.
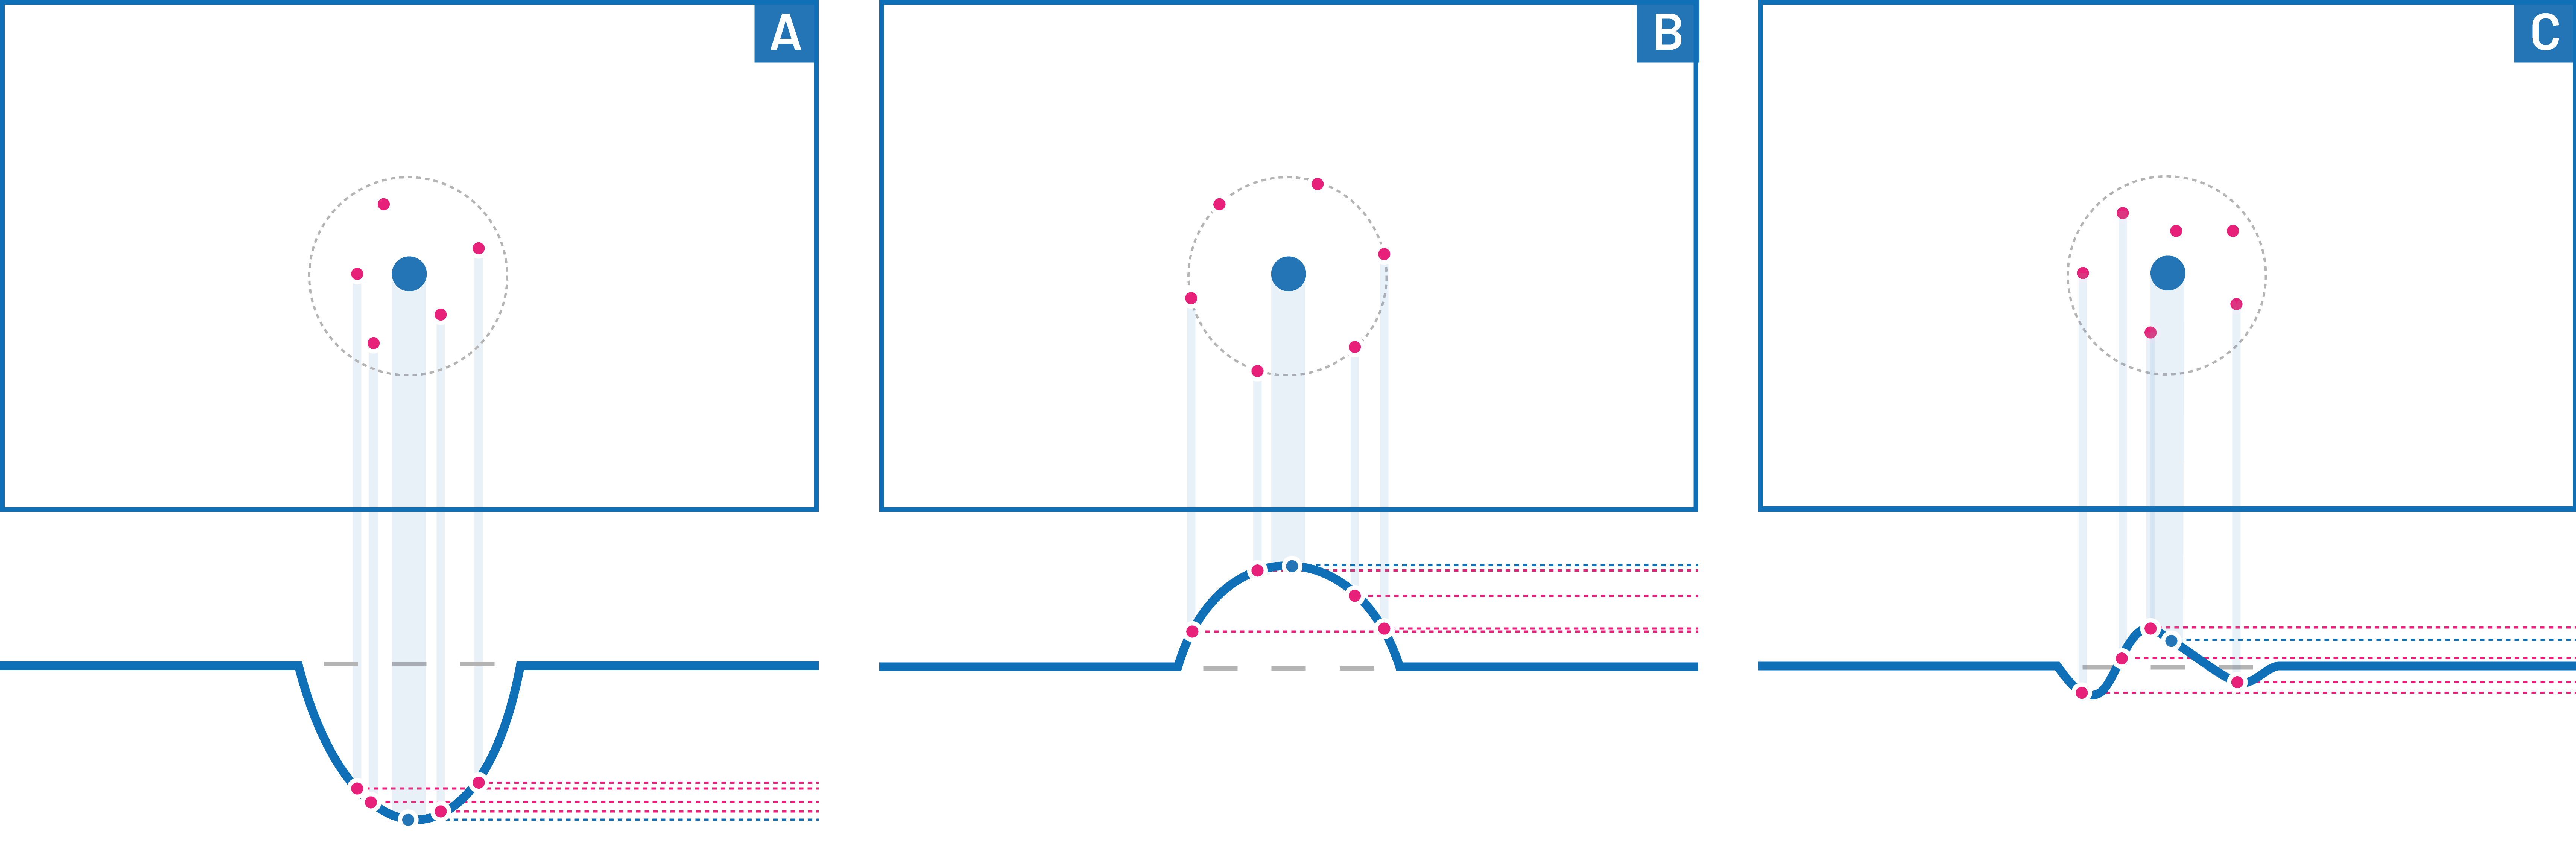
The type of extremum is determined either by comparing the depth values at fixed, predefined positions within the surrounding area (A), at a fixed distance from the extremum (B), or in the form of randomly determined values (C): When pressing in, the majority of depth values within the surrounding area lie between the extremum and the surface’s resting position (A); the same applies when pulling out (B). The distinction is made on the basis of the relative position of the extremum in front of or behind the surface. Sensor noise or irregular shapes produce mixed relative depth values (C).
However, this means that complex deformations in other contexts are no longer detected, for example convex shapes in tangibles or arbitrary deformation in the context of collaborative interaction.
Extremum Classification
Two methods can be used to classify extrema: The basic classification is based on the change in sign of the differences between the gradients (corresponding to the second partial derivative). A disadvantage of this approach is that, due to sensor noise, the measurement inaccuracy for subtle deformations sometimes remains below the tolerance threshold.
A more robust method is to sample various depth values in the vicinity of the local extremum. This can be carried out on the basis of predefined positions within the vicinity, within a constant radius of the extremum, or as stochastic sampling with random positions. The depth values are checked at each individual position. If the majority of values are closer to the zero plane, this indicates a user interaction; if the depth values are further away from the surface, this indicates an extremum between several interactions. If the distribution is even, the extremum is discarded. The required ratio of matching points and the number of points can be configured within the framework.
Identification of Touch
The unambiguous identification of the points at which the surface is deformed by the user, and their tracking by the sensor across multiple measurement time points, is a prerequisite for the use of gestures on the Elastic Display. Furthermore, the assignment of an ID also enables the recognised positions to be smoothed and filtered over time.
The individual steps for determining the Touch ID for a detected surface deformation are as follows:
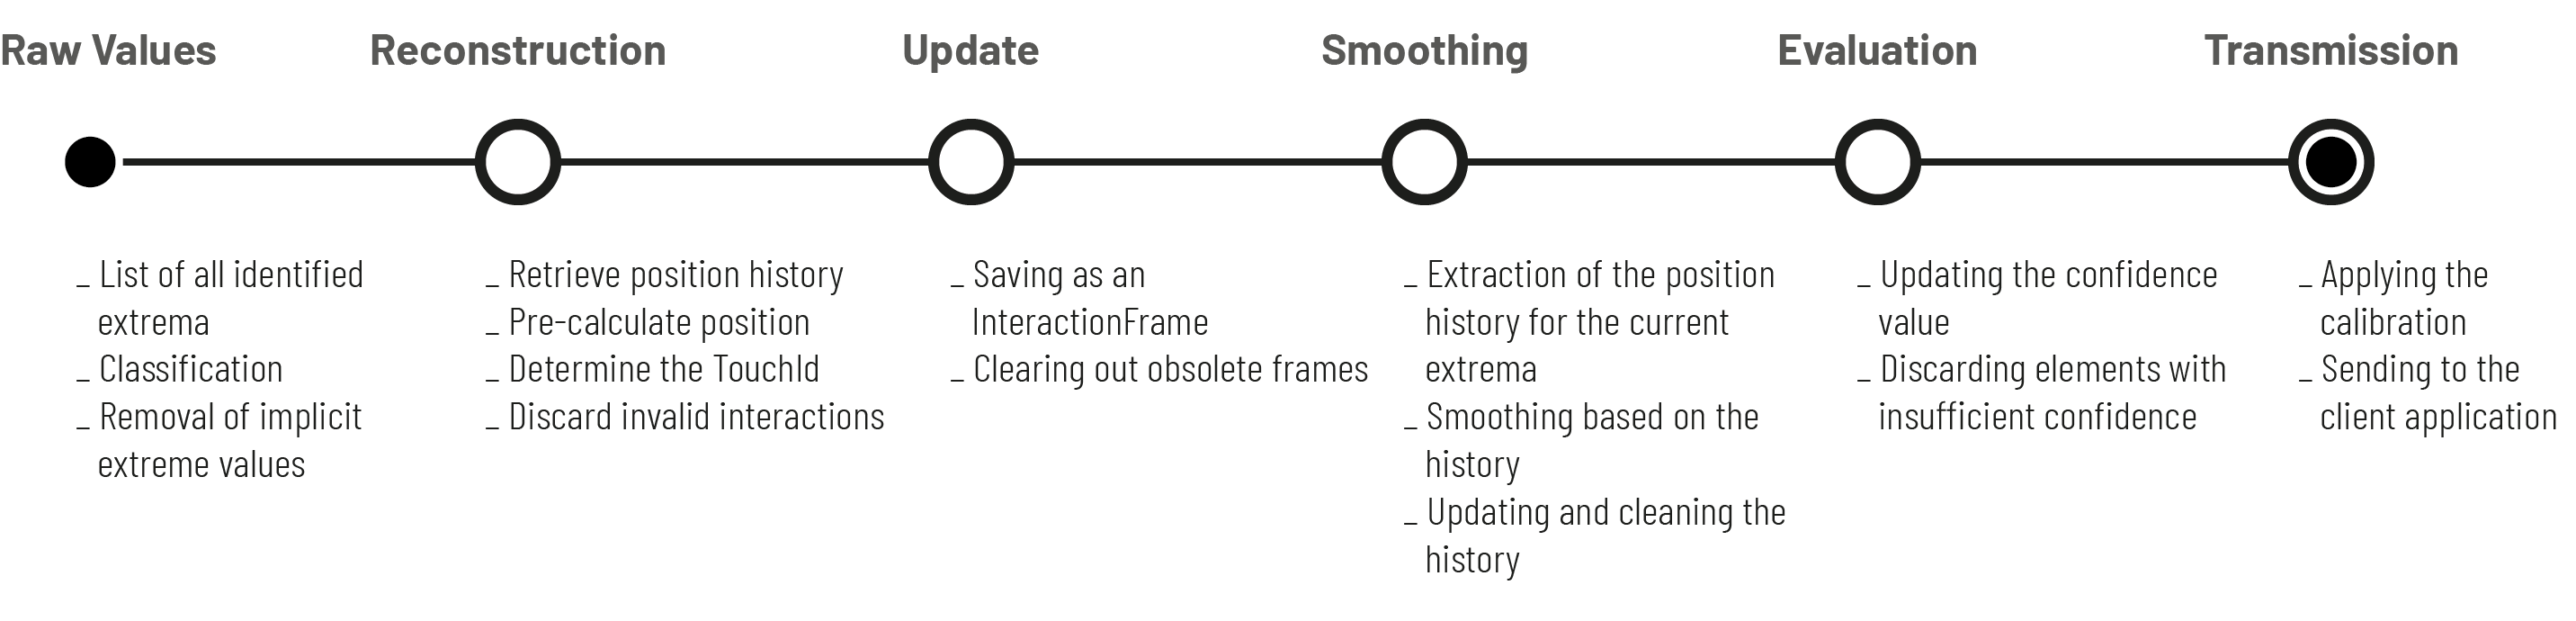
Based on the classification, implicit extrema are first removed. The extreme values are then mapped to known interaction points from previous measurement timepoints. This requires temporary storage across several frames. This is provided in two different formats:
-
InteractionFrames: a list of all interaction points for a given measurement time, identified by a frame ID.
-
InteractionHistory: the history of positions for each detected interaction across the previous frames.
Storing data in these two formats involves a certain degree of redundancy, as all necessary information can also be reconstructed from either of the two lists. However, for performance reasons, these lists are maintained to speed up simple lookup operations and to avoid having to carry out the more resource-intensive reconstruction process again in every frame. Following association, the touch IDs are stored together with the position data in the InteractionFrames list, and position smoothing is performed for each point based on the history. Subsequently, the confidence value is updated and, where necessary, individual outliers are discarded.
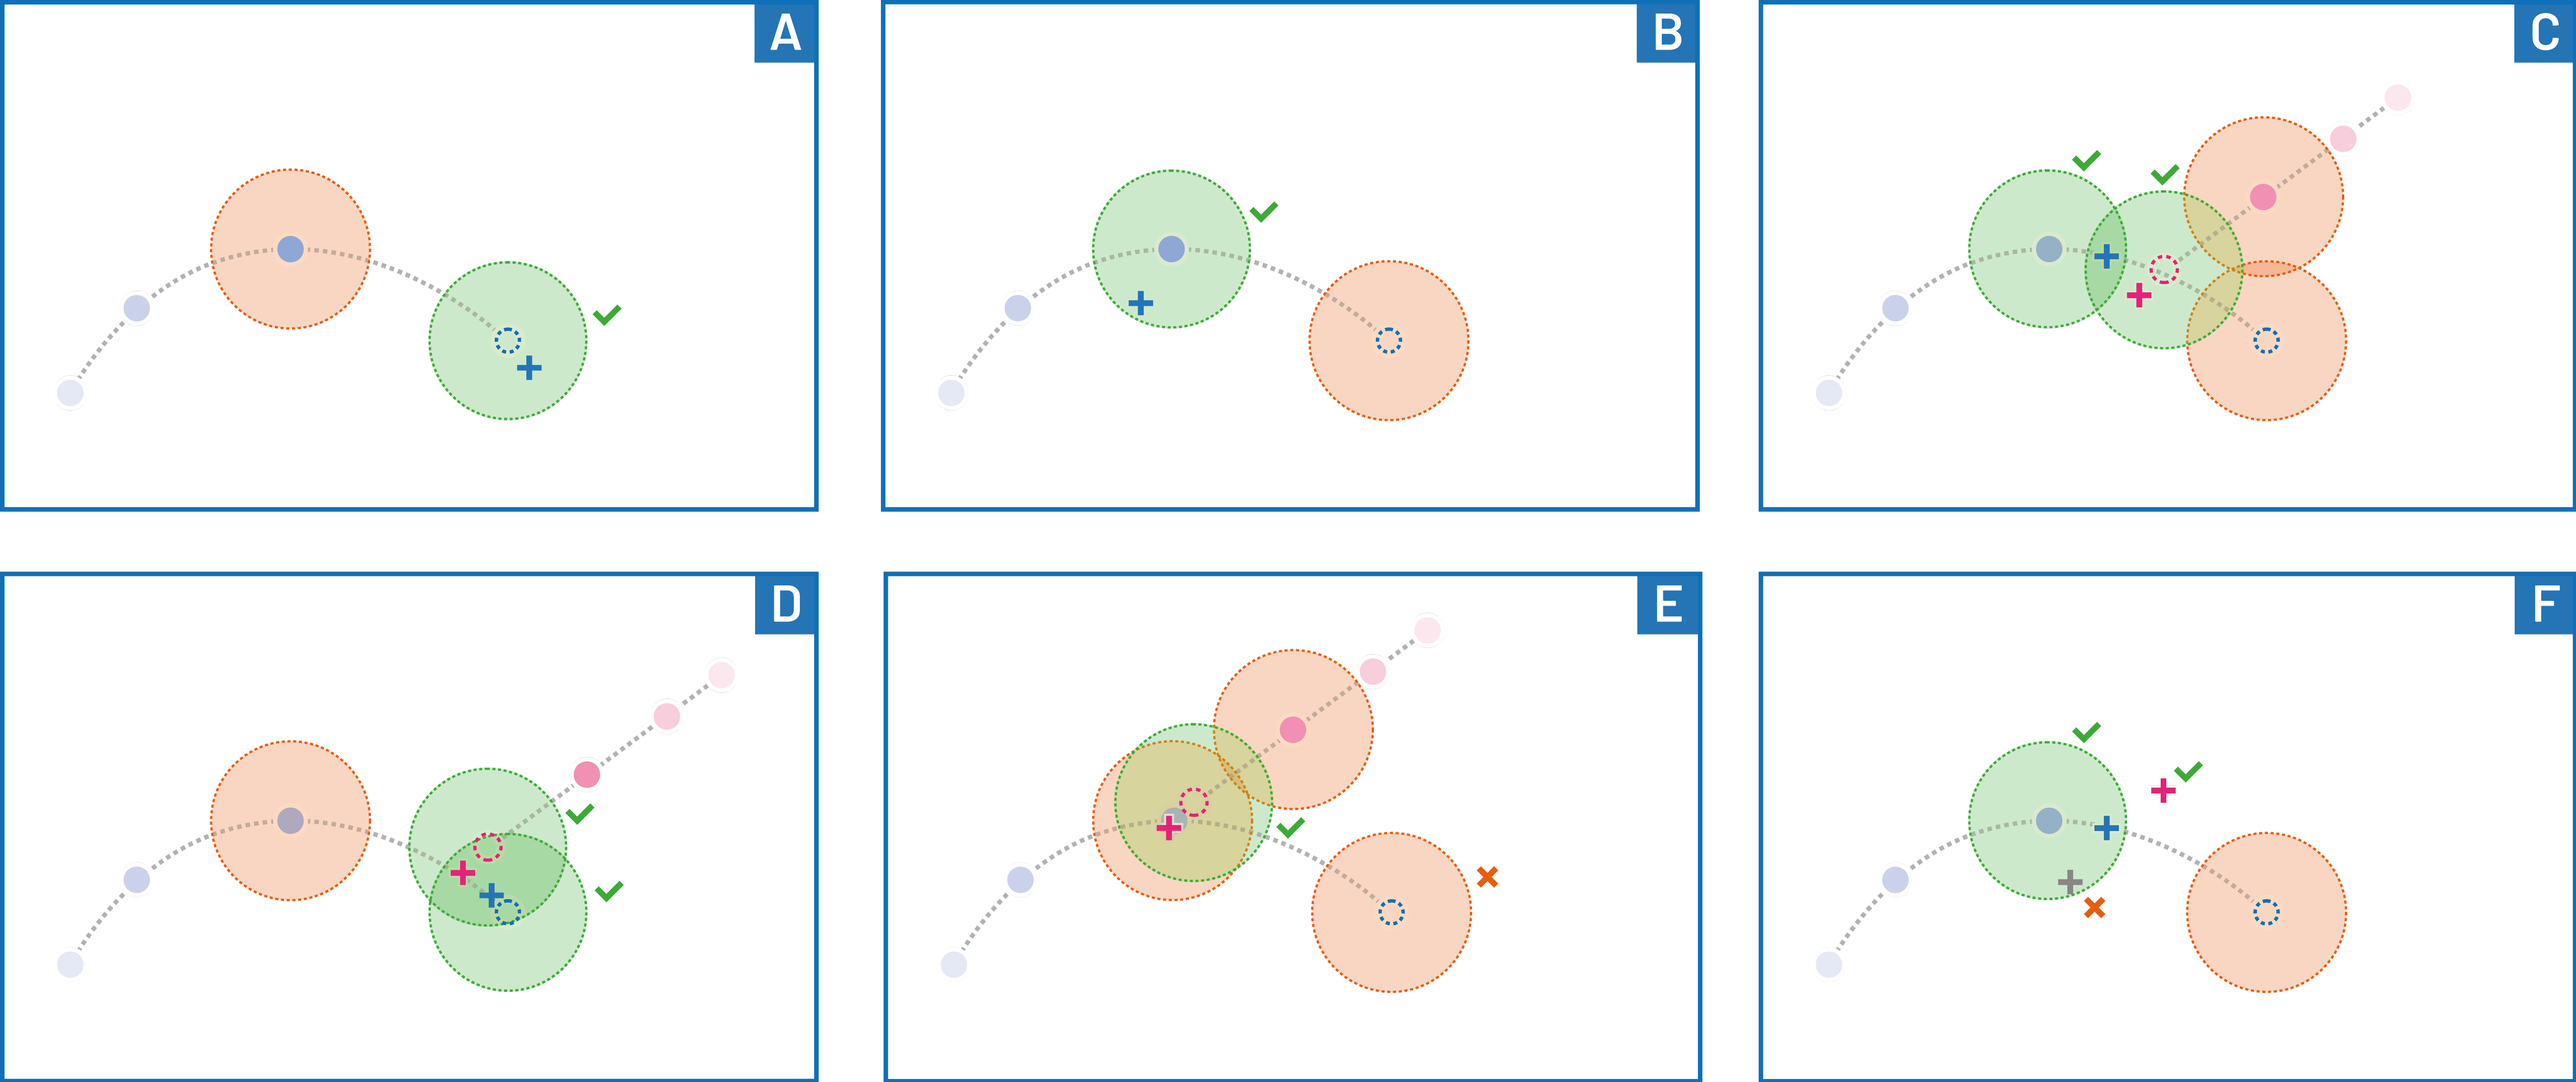
The assignment of the ID is the final step in the analysis phase of the processing pipeline. The procedure involves a multi-stage process, in which a position prediction is first made based on the movement in the preceding frames. For all current extrema within a predefined radius of this position, the corresponding ID and the distance to the pre-calculated position are stored (A). In addition, a search is carried out again within the same radius around the last position in order to be able to detect rapid changes in direction as well (B). This is done for all detected extrema. In the best-case scenario, after this step, each extreme value is assigned an ID with one or two distances, thereby uniquely identifying the ID regardless of the associated distance. This is used to resolve conflicts when multiple IDs are associated with different distances. The simplest case here is when two or more extreme values are candidates for IDs with the same number. In this case, the combination of IDs that minimises the positional deviations is assigned (C,D). However, it is often the case that the number of suitable IDs differs from the number of remaining touch points. If there are too few IDs available, the system first checks again to determine which combination minimises the positional deviations.
For extrema that do not have an ID following this assignment, a check is carried out to determine whether a new interaction should be created or whether this extreme value should be discarded due to its excessive proximity to one of the other points (F). If there are more IDs than extrema, this indicates that one extremum is obscuring the other, usually due to spatial proximity. This is particularly the case when interactions move towards one another, such as during a pinch-to-zoom gesture to zoom out. The challenge in this case is to prevent IDs from being discarded or reassigned. The chosen approach is to set the IDs with the shortest distance to the pre-calculated positions (E).

At the same time, however, the discarded IDs are stored in the history with a negative confidence value and the nearest extreme value, so that these values can also be used to calculate the position in the next frame and the respective IDs can be reactivated accordingly. For this procedure, the maximum number of frames can be specified before these IDs are removed from the history and the interaction is finally discarded.
This allows a deformation that has been overlaid by another interaction to be reconstructed. This is the case, amongst other things, when two interactions approach one another (A). If the distance is too small, only one extremum is detected and, based on the position, the touch ID of the nearest pre-calculated position is assigned (B). However, the discarded extremum is stored in the history and restored in one of the subsequent frames based on the trajectory (C).
For pre-calculation and distance comparisons, the lateral positions are primarily used; depth is only incorporated into the calculations as a weighting factor in the event of significantly different values.